
Figures & data
Figure 1. Dose-dependent effect of EAELN and EAELT on the viability of PC3 cancer cells. Cell viability was determined by an MTT assay and was expressed as a percentage. Cells were treated with tow extracts at different concentrations for 72 h. Data are expressed as mean ± SD (n = 3), ***p < 0.001, ****p < 0.0001, EAELN versus EAELT. Two-way ANOVA followed by Bonferroni’s correction.
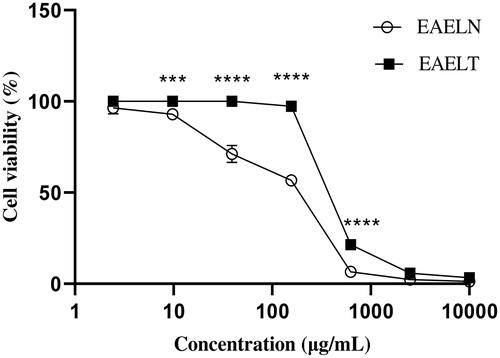
Figure 2. Dose-dependent effects of EAELN and EAELT on the viability of MDA-MB-231 cancer cells. Cell viability was determined by an MTT assay and was expressed as a percentage. Cells were treated with tow extracts at different concentrations for 72 h. Data are expressed as mean ± SD (n = 3), **p < 0.01, ****p < 0.0001, EAELN versus EAELT, Two-way ANOVA followed by Bonferroni’s correction.
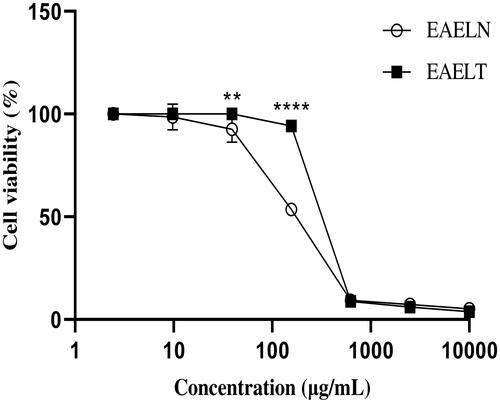
Table 1. IC50 values (μg/mL) of ethyl acetate extracts of L. numidicum (EAELN) and L. trigynum (EAELT) against the prostate cancer line (PC3) and the breast adenocarcinoma line (MDA-MB-231).
Figure 3. Induction of apoptosis by EAELN in PC3 cancer cells. (A) Representative histograms of cells sorted by flow cytometry. Cells were treated with the extract for 24 h at different concentrations (250, 500, and, 1000 μg/mL) and stained with Annexin V-FITC and propidium iodide before sorting by flow cytometry. Cells in the Q5-UL, Q5-UR, Q5-LL and Q5-LR quadrants represent necrotic, late apoptotic, viable and early apoptotic populations, respectively. (B) Quantification of apoptotic cells. The percentage of apoptotic cells was calculated. Each bar represents the mean ± SD (n = 3), *p < 0.05, ****p < 0.0001, compared with control. One-way ANOVA followed by Bonferroni’s correction.
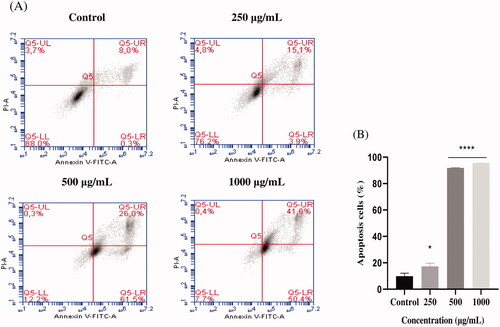
Figure 4. Induction of apoptosis by EAELT in the PC3 cancer cell. (A) Representative histograms of cells sorted by flow cytometry. Cells were treated with the extract for 24 h at different concentrations (250, 500, and, 1000 μg/mL) and stained with Annexin V-FITC and propidium iodide before sorting by flow cytometry. Cells in the Q5-UL, Q5-UR, Q5-LL and Q5-LR quadrants represent necrotic, late apoptotic, viable and early apoptotic populations, respectively. (B) Quantification of apoptotic cells. The percentage of apoptotic cells was calculated. Each bar represents the mean ± SD (n = 3), *p < 0.05, ****p < 0.0001, compared with control. One-way ANOVA followed by Bonferroni’s correction.
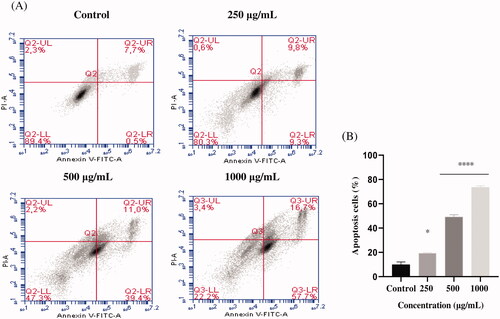
Figure 5. The effect of EAELN on cell cycle distribution in PC3 cell lines. The PC3 cell line was incubated for 24 h with the extract at different concentrations (250, 500 and 1000 μg/mL). (A) Flow cytometry analysis of cell distribution is represented by PI fluorescence histograms. The experiment was repeated three times. (B) The percentages of cells in the different phases are shown in the bar graph. With increasing extract concentration, the number of cells in the G2/M phase increased while that in the G0/G1 and S phase decreased. EAELN blocks cells in the G2/M phase. Data are presented as means ± SD (n = 3), ***p < 0.001, ****p < 0.0001, compared with control. Two-way ANOVA followed by Bonferroni’s correction.
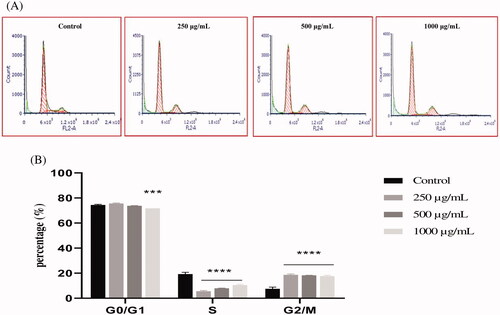
Figure 6. The effect of EAELT on cell cycle distribution in PC3 cell lines. The PC3 cell line was incubated for 24 h with the extract at different concentrations (250, 500, and 1000 μg/mL). (A) Flow cytometry analysis of cell distribution is represented by PI fluorescence histograms. The experiment was repeated three times. (B) The percentages of cells in the different phases are shown in the bar graph. With increasing extract concentration, the number of cells in the G0/G1 and G2/M phase increased while that in the S phase decreased. EAELT extracts blocked cells in G0/G1 and G2/M phases. Data are presented as means ± SD (n = 3), *p < 0.05, **p < 0.01, ****p < 0.0001, compared with control. Two-way ANOVA followed by Bonferroni's correction.
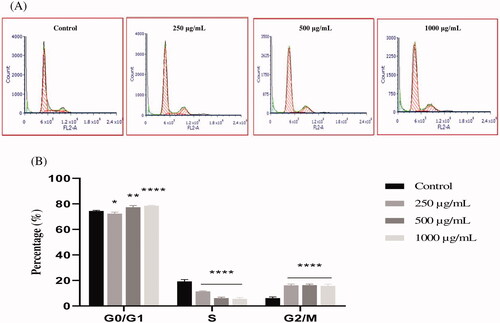
Figure 7. (A) LC − ESI − DDA − HRMS base peak chromatogram of EAELN in negative ion mode. (B) LC − ESI − DDA − HRMS base peak chromatogram of EAELT in negative ion mode.
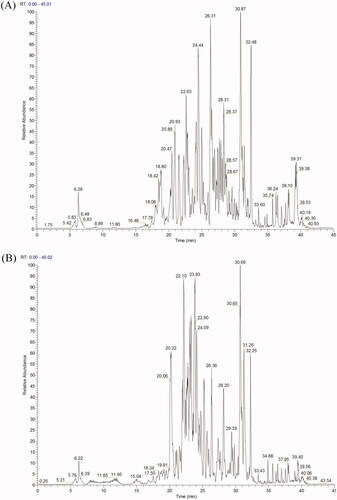
Table 2. Compounds characterised by LC-RHMS/MS analyses of ethyl acetate extracts of L. numidicum (EAELN) and L. trigynum (EAELT).