Figures & data
Figure 1. Structure of toddalolactone.
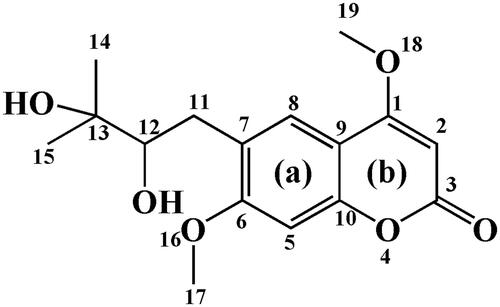
Figure 2. Representative LC profiles of toddalolactone and its metabolites produced in HLMs, RLMs, PLMs, RAMs, MLMs, DLMs and MIMs. Toddalolactone (20 μM) was incubated with an NADPH-dependent system at 37 °C for 60 min.
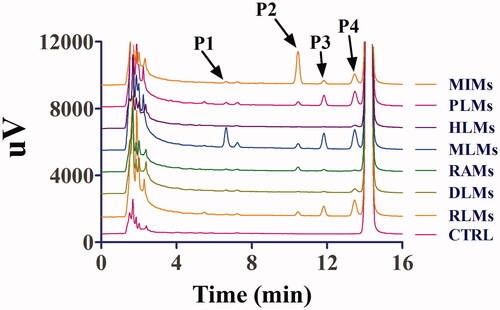
Figure 3. Representative HPLC profiles of toddalolactone and its metabolites in MLMs, DLMs, HLMs, PLMs, RAMs, MIMs and RLMs. Toddalolactone (20 μM) was incubated with a UDPGA-dependent system at 37 °C for 60 min.
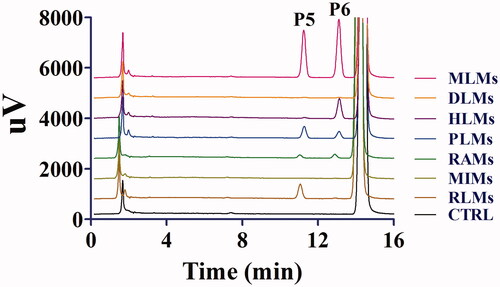
Table 1. Peak area percentages of each metabolite in different microsomes.
Figure 4. Kinetics of toddalolactone metabolism in RLMs, DLMs, MLMs, HLMs, RAMs, MIMs, PLMs, CYP1A1 and CYP3A5 in the presence of an NADPH system. The Eadie–Hofstee plots (V–V/S plot) are shown as an inset. Data represent the mean of triplicate determinations.
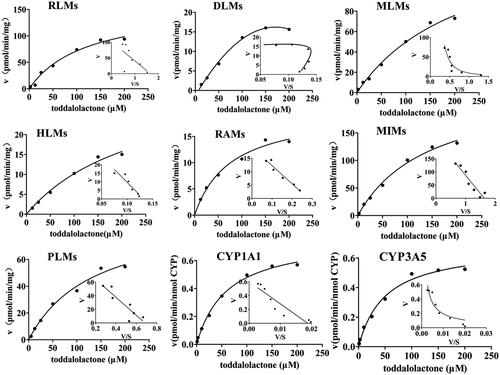
Figure 5. Kinetics of toddalolactone glucuronidation in RLMs, MLMs, HLMs, RAMs and PLMs. The Eadie–Hofstee plots (V–V/S plot) are shown as the inset. Data points represent the mean of triplicate determinations.
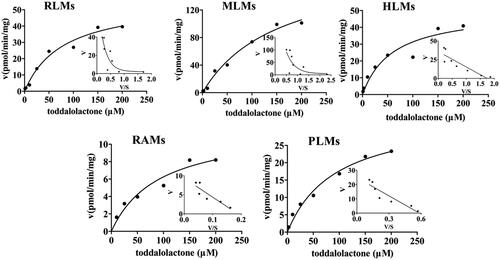
Table 2. Kinetic parameters of metabolite production from toddalolactone in P450-catalyzed drug oxidation reactions.
Table 3. Kinetic parameters of metabolite production from toddalolactone in glucuronide metabolism.
Figure 6. Metabolic stability profiles of toddalolactone in HLMs, DLMs, PLMs, MLMs, RAMs, RLMs and MIMs for oxidative metabolism (A) and glucuronidation of toddalolactone (B). Data represent the mean ± SD. N = 3. *p < 0.05 versus HLMs at each time-point (0, 30, 60 and 90 min).
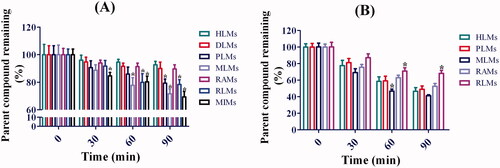
Figure 7. Representative chromatogram of toddalolactone and its metabolites incubated with recombinant human cytochrome P450s. Toddalolactone (20 μM) was incubated with each P450 isoform (15 nM) at 37 °C for 60 min.
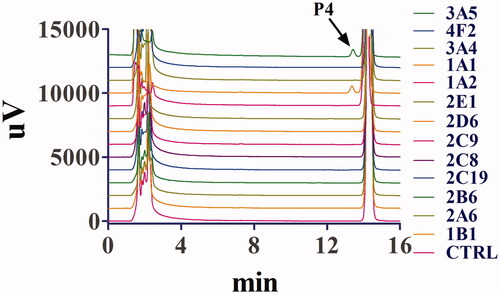
Figure 8. Effects of selective P450 inhibitors on the formation of metabolite (P4) in HLMs. Results are shown as mean ± SD of at least three separate assays.
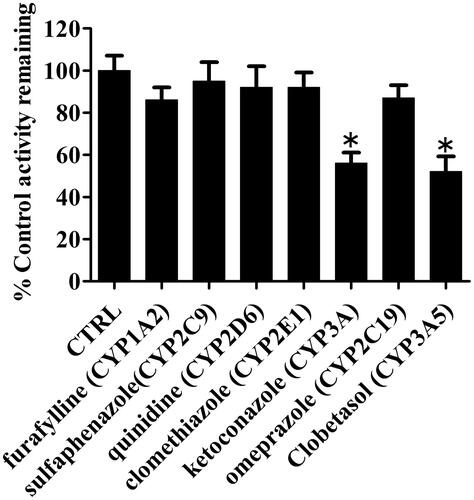
Figure 9. Binding mode of toddalolactone with CYP 1A1 and CYP3A5. CYP protein is shown as a ribbon, Haem is shown as the blue stick, and toddalolactone is displayed as the green stick.
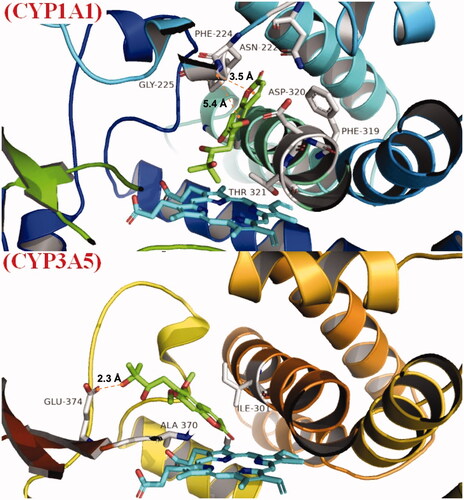
Figure 10. Molecular dynamics analysis of the P450 1A1/toddalolactone complex. (A) The P450 1A1 is shown in the surface representation (PDB code: 4I8V). (B) A 3D view of the binding pose. The major amino acids located at the active site are shown. (C) RMSD plot over a 50 ns simulation. (D) RMSF curve during the 50 ns MD simulation. (E) A 2D interaction diagram of P450 1A1 with toddalolactone. Hydrogen bond interactions are rendered as purple arrows, and pi–pi stacking interactions are denoted by green solid lines. (F) Interaction fraction of CYP 1A1 key amino acids from the 50 ns MD simulation.
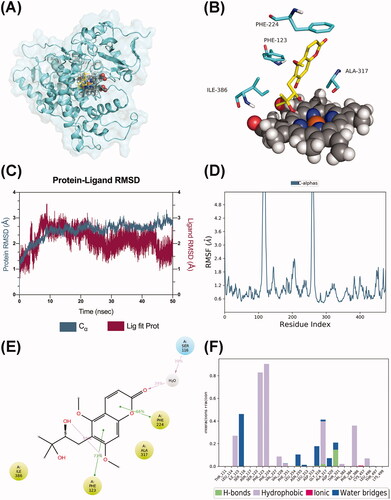
Figure 11. Molecular dynamics analysis of the P450 3A5/toddalolactone complex. (A) P450 3A5 is shown in the surface representation (PDB code: 5VEU). (B) A 3D view of the binding pose. The major amino acids located at the active site are shown. (C) RMSD plot over the 50 ns simulation. (D) RMSF curve during the 50 ns MD simulation. (E) A 2D interaction diagram of P450 3A5 with toddalolactone. Hydrogen bond interactions are rendered as purple arrows, and pi-pi stacking interactions are denoted by green solid lines. (F) Interaction fraction of CYP3A5 key amino acids from the 50 ns MD simulation.
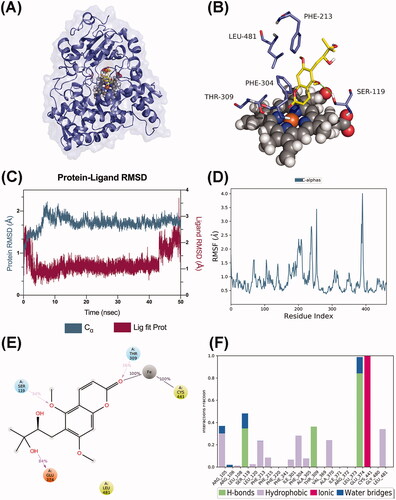
Figure 12. Effect of toddalolactone (TOD) on CYP3A5 (A) and CYP1A1 (B) protein levels in HepG2 cells at various concentrations (0 μM, 10 μM and 50 μM). DMSO (0.1%) in the absence of toddalolactone was used as the control group. Results are presented as fold-induction relative to control. Values are means ± SD (n = 4) and the significant difference compared with the control group, *p < 0.05.
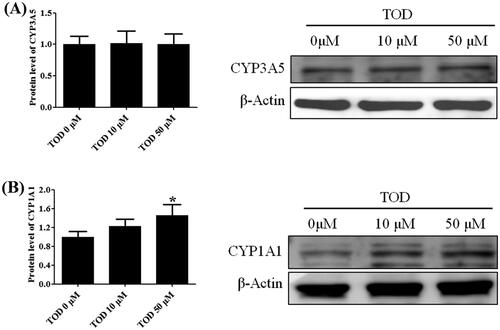
Figure 13. The plasma concentration profiles after intravenous administration of toddalolactone at a single dose of 10 mg/kg. Data represent the mean ± SD of six rats.
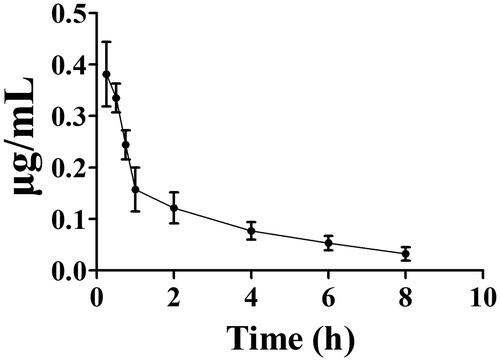
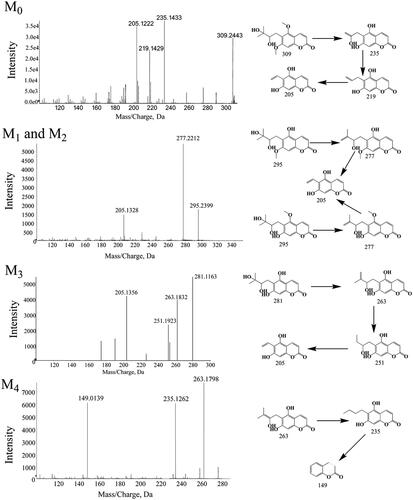
Figure 14. Mass spectrum (MS/MS) of toddalolactone and its metabolites.