Figures & data
Table 1. Effects of isopsoralen on body weight, liver weight and liver/body weight ratio.
Figure 1. Effects of isopsoralen on serum biochemical indices. ALT (u/L), AST (u/L), ALP (u/L), TBA (mmol/L), TP (u/L), ALB (g/L), TBIL (μmol/L), TG (mmol/L) and TC (mmol/L). Data are shown as mean ± SEM (n = 14, half female and half male). *p< 0.05, **p< 0.01 and ***p< 0.001 indicate significant difference from the control group.
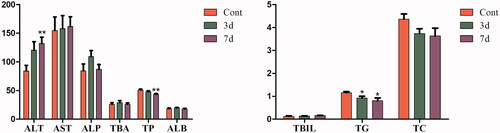
Figure 2. The sections of mice liver before and after isopsoralen-treatment with H&E staining. Cont: control group; 3d: 3d group; 7d: 7d group.
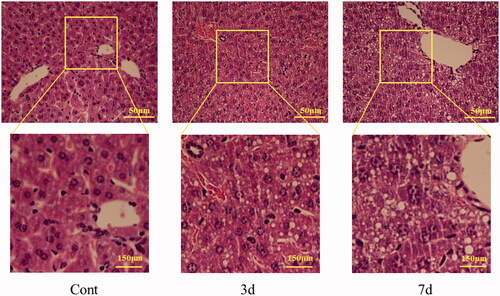
Figure 3. Lipid contents in liver homogenate from mice after isopsoralen administration for 3 days and 7 days. Data are represented as the mean ± SEM (n = 14, half female and male mice). **p < 0.01 and ***p < 0.001 compared with control group.
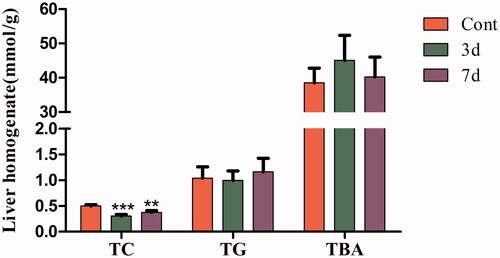
Figure 4. Changes of expression levels of hepatic transporters in the livers. (A) Protein expression levels of hepatic BA transporters as shown by western blot. (B) Relative expression levels of BA transporters to β-actin. The value is expressed as the mean ± SEM, n = 6. The mean value of the control group was normalized (all recorded as 1), *p< 0.05, **p< 0.01 indicate significant difference.
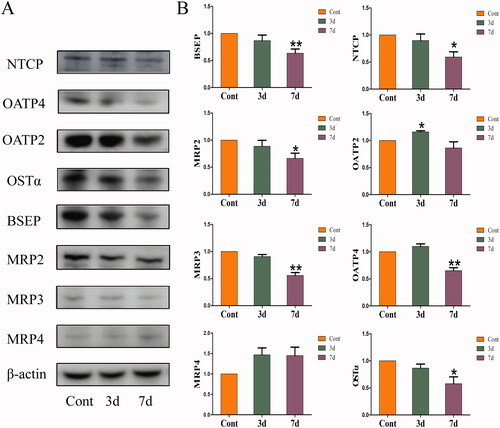
Figure 5. Changes of expression levels of bile acid receptor and binding enzyme in the livers. (A) Protein expression levels as shown by western blot. (B) Relative expression levels of FXR, BAAT and BACS to β-actin. The value is expressed as the mean ± SEM, n = 6. The mean value of the control group was normalized (all recorded as 1), *p< 0.05 indicate significant difference.
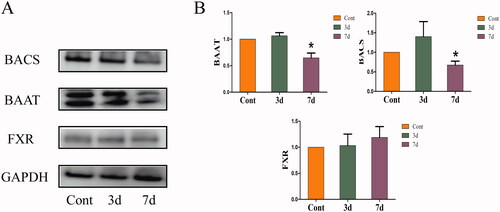
Figure 6. Changes of bile acids concentrations and compositions in mice liver after isopsoralen treatment analysed by UHPLC–MS/MS. (A) Changes of contents of each BA. (B) Changes of total amount of unconjugated-BAs, taurine-BAs and glycine-BAs upon isopsoralen administration. (C) Changes of proportion of unconjugated-BAs, taurine-BAs and glycine-BAs in total BAs before and after isopsoralen administration. (D) The proportions of each BA as percentage of total bile acid before and after isopsoralen administration. Data represented as mean ± SEM (n = 14, half female and male mice). *p< 0.05, **p< 0.01 and ***p< 0.001, significantly different compared with control group.
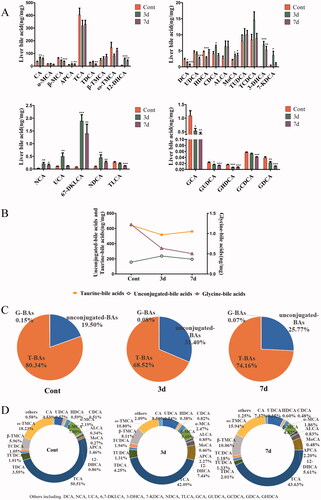
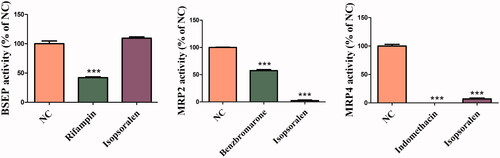
Figure 7. Effects of isopsoralen on the transport activity of bile acid transporters. The values are expressed as the mean ± SEM (n = 3). ***p< 0.01 indicates significant difference.