
Figures & data
Figure 1. Effect of PU on water content and histopathology of IVDs in IDD rats. (A) Chemical structure of puerarin; (B) comparison of water content in IVD in each group; (C) pathological observation (HE staining, scale = 50 μm) Sham group. VB: vertebral body, NP: nucleus pulposus, AF: annulus fibrosus. Data are represented by mean ± SD, n = 9. *p < 0.05, vs. Sham group, #p < 0.05, vs. IDD group, &p < 0.05, vs. low PU group.
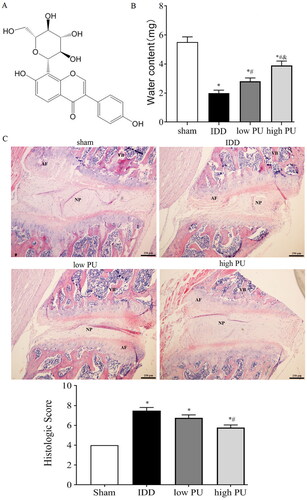
Figure 2. Effects of PU on inflammatory factors and ECM, apoptosis related proteins in IDD rats. (A) The contents of TNF-α, IL-6, and IL-1β in IVD tissues were analysed by ELISA; B: The protein expression levels of Collagen II, Aggrecan, Bax and Bcl-2 were analysed by western blot. Data are represented by mean ± SD, n = 9. *p < 0.05, vs. Sham group, #p < 0.05, vs. IDD group, &p < 0.05, vs. low PU group.
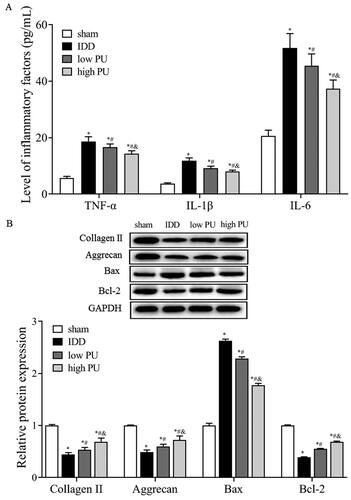
Figure 3. Effects of PU on TLR4/NF-κB signalling pathway in IDD rats. (A, B) IHC analysis of TLR4 expression in IVD tissue (scale = 100 μm). VB: vertebral body, NP: nucleus pulposus, AF: annulus fibrosus; C: The protein expression levels of TLR4, MyD88, and p-p65 were analysed by western blot. Data are represented by mean ± SD, n = 9. *p < 0.05, vs. Sham group, #p < 0.05, vs. IDD group, &p < 0.05, vs. low PU group.
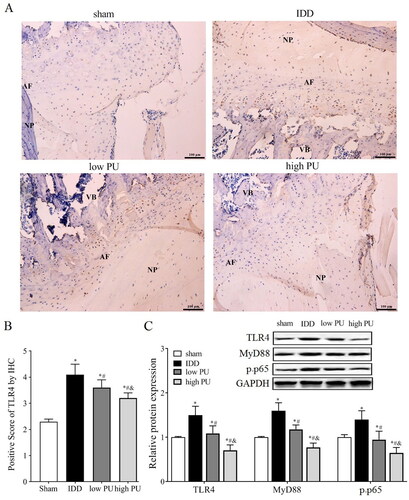
Figure 4. Effects of PU on the cell viability of NPCs. (A) The cytotoxic effect of PU on NPCs was determined at various concentrations for 24 h using a CCK8 assay; (B) effects of PU on cell viability of NPCs by CCK-8 assay; (C) The protein expression levels of Ki-67 were analysed by western blot (a: control group, b: IL-1β group, c: 100 μmol/mL PU group, d: 200 μmol/mL PU group, e: TAK-242 group); (D) The morphology of NPCs under optical microscope. Data are represented by mean ± SD, n = 3. *p<.05, vs. control group, #p < 0.05, vs. IL-1β group, &p < 0.05, vs. 100 μmol/mL PU group.
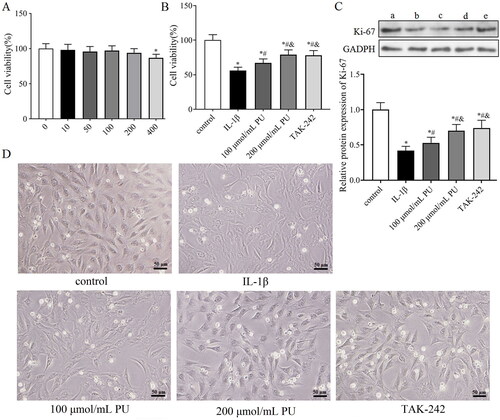
Figure 5. Effects of PU on apoptosis of IL-1β-treated NPCs. (A) The poptosis rate of NPCs detected by Annexi-V/PI double staining; (B) Effect of PU on the cell cycle of IL-1β-treated NPCs assessed by flow Cytometry; (C) The expression levels of Bax and Bcl-2 were analysed by western blot (a: control group, b: IL-1β group, c: 100 μmol/mL PU group, d: 200 μmol/mL PU group, e: TAK-242 group). Data are represented by mean ± SD, n = 3. *p < 0.05, vs. control group, #p < 0.05, vs. IL-1β group, &p < 0.05, vs. 100 μmol/mL PU group.
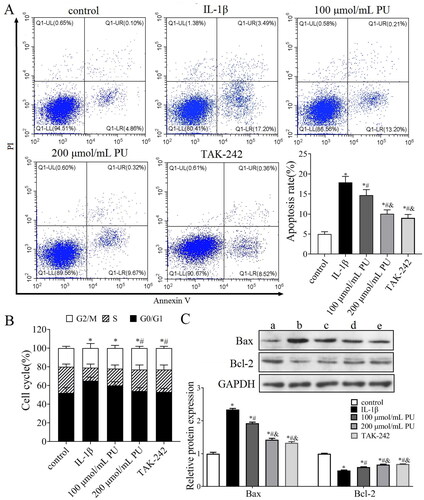
Figure 6. The effect of PU on inflammatory factors, ECM and TLR4/NF-κB signalling pathway in IL-1β-treated NPCs. (A) The contents of TNF-α and IL-6 were analysed by ELISA; (B,C) The expression levels of Collagen II, Aggrecan, TLR4, MyD88, and p-p65 were measured by Western blot (a: control group, b: IL-1β group, c: 100 μmol/mL PU group, d: 200 μmol/mL PU group, e: TAK-242 group). Data are represented by mean ± SD, n = 3. *p < 0.05, vs. control group, #p < 0.05, vs. IL-1β group, &p < 0.05, vs. 100 μmol/mL PU group.
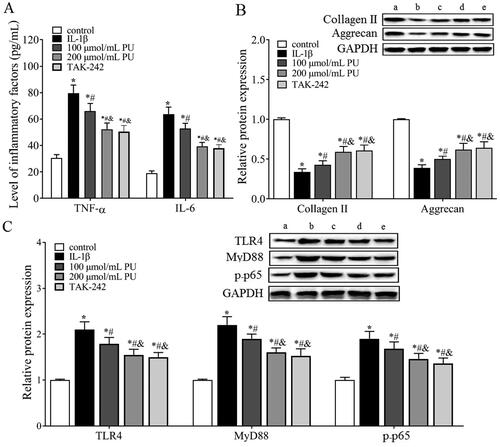
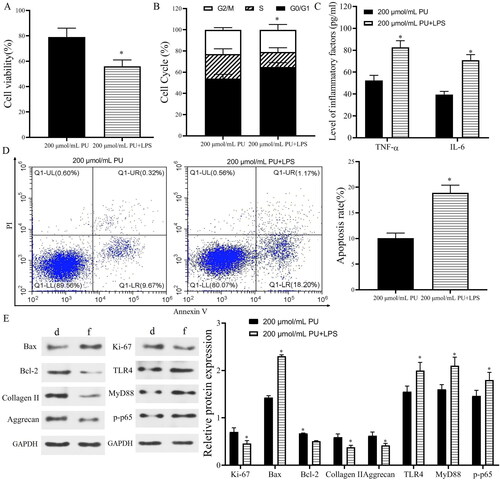
Figure 7. LPS reversed the effect of PU in IL-1β-treated NPCs. (A) The cell viability NPCs detected by CCK-8; (B) The cell cycle assessed by flow cytometry; (C) The contents of TNF-α and IL-6 were analysed by ELISA; (D) The poptosis rate of NPCs detected by Annexi-V/PI double staining; (E) The expression levels of Ki-67, Bax, Bcl-2, Collagen II, Aggrecan, TLR4, MyD88, and p-p65 (d: 200 μmol/mL PU group, f: 200 μmol/mL PU + LPS group). Data are represented by mean ± SD, n = 3. *p < 0.05, vs. 200 μmol/mL PU group.
Data availability statement
Data supporting the findings of this study are available from the corresponding author on request.