Figures & data
Table 1. The corresponding antibody name, manufacturer and dilution multiple list in Western blot experiment.
Table 2. The mRNA primer sequence list for real-time quantitative PCR (qRT-PCR) in the experiment.
Figure 1. Composition and structure of F.AOH. (A, B) (Lin et al. Citation2020) macroscopic appearance and histological evaluation of gastric mucosa in rats with acetic acid-induced gastric mucosal damage (D, E), (a, g) normal group; (c, i) positive control group ranitidine (100 mg/kg); (d, j) F.AOH low- (13.5 mg/kg); (e, k) medium- (27 mg/kg); (f, l) high-dose (54 mg/kg); (b, h) model group treated with acetic acid; flowchart of experiments (C); F.AOH can increase the ulcer inhibition rate and decrease ulcer index in rats with GU (F, G). ##p < 0.01 compared with model group (n = 6).
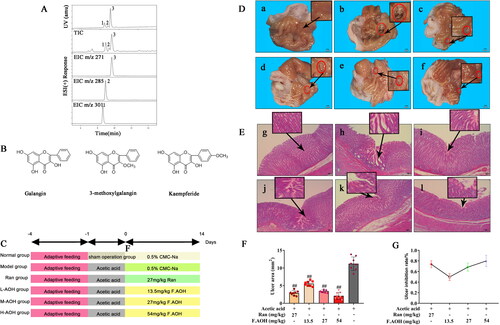
Figure 2. The levels and expressions of endothelin-related inflammatory factors (A–C), the expression levels of nitric oxide synthase, and ET-1 proteins were analysed; (D–F) the levels of inflammatory factors NO, IL-6 and TNF-α in serum. **p < 0.01 compared with normal group; #p < 0.05 and ##p < 0.01 compared with model group (n = 6).
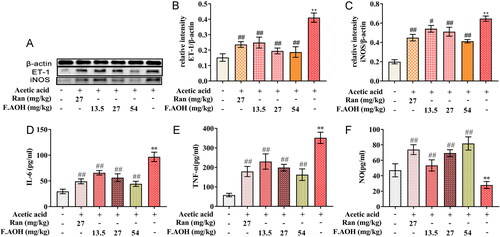
Table 3. F.AOH attenuates oxidative stress in rats with gastric injury induced by acetic acid.
Figure 3. F.AOH promoted proliferation, migration and inhibiting apoptosis of GES-1 cells in vitro. (A, B) Flow cytometry and apoptosis rates for each group: (a) normal group, (b) positive control group ranitidine, (c) F.AOH low- (13.5 mg/kg), (d) medium- (27 mg/kg), (e) high-dose- (54 mg/kg), (f) model group treated with ethanol; (C) F.AOH can promote the penetration rate of GES-1 cells in transwell test: (a) normal group, (b) model group treated with ethanol, (c) positive control group ranitidine, (d) F.AOH low- (13.5 mg/kg), (e) medium- (27 mg/kg), (f) high-dose- (54 mg/kg); (D–H) F.AOH inhibiting the expression of Bcl-2/Bax/caspase-3 pathway proteins and mRNA in GES-1 apoptosis in vitro. *p < 0.05 and **p < 0.01 compared with normal group; #p < 0.05 and ##p < 0.01 compared with model group.
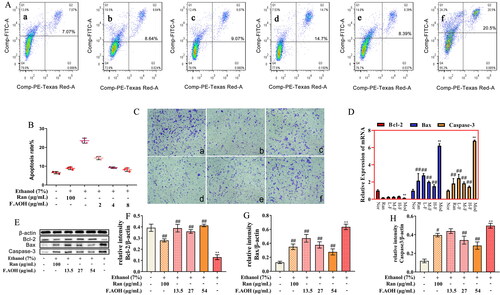
Figure 4. (A) Venn maps of differential gene expression. The volcanic map of (B) NOR vs. AC and (C) AC vs. MD (red dots are upregulated genes, blue dots are upregulated genes and grey dots are non-significant differential genes).
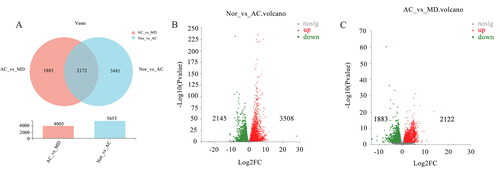
Figure 5. The map of GO enrichment and KEGG pathway enrichment analysis of differential genes. (A, B) GO functional enrichment analysis map of NOR vs. AC and AC vs. MD (single gene bubble map of the top 20 enrichment abundance); (C, D) the KEGG functional enrichment analysis map of NOR vs. AC and AC vs. MD (single gene set bubble map of the top 30 enrichment abundance).
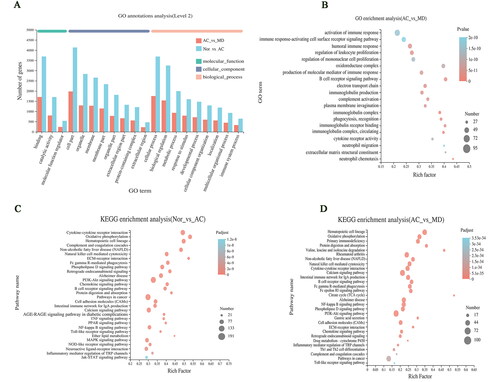
Figure 6. The 30 genes with the most significant differences among all differential genes in the first 30 signalling pathways enriched by KEGG of AC vs. MD.
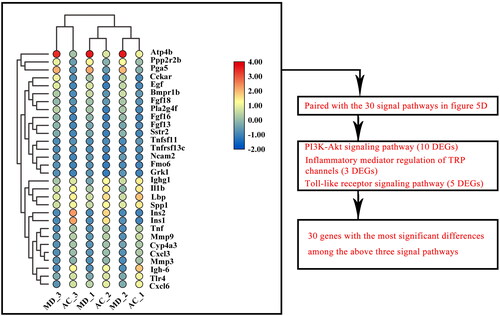
Figure 7. PPI network recognition of key genes and Western blot and qPCR verification experiments. (A–L) PI3K-Akt pathway, Toll-like receptor pathway and inflammatory mediators regulate the relative expression levels of TRP channel-related genes and proteins. **p < 0.01 compared with normal group; ##p < 0.01 compared with model group: values are expressed as means ± standard deviation (n = 3).
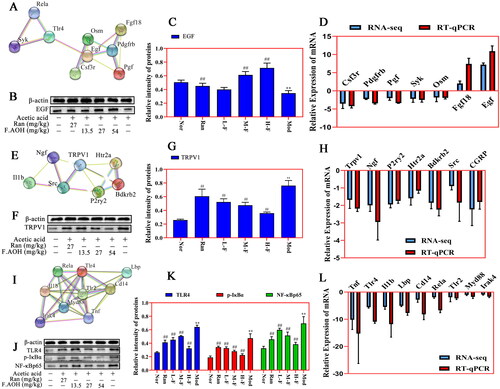
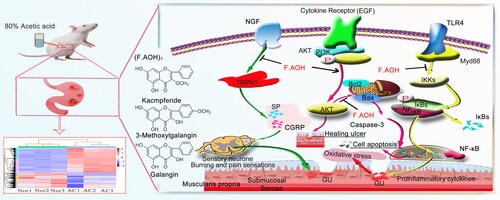
Figure 8. F.AOH is involved in TLR4/NF-κB and TRPV1 signalling pathways and gastric mucosal ulcer healing.