
Figures & data
Figure 1. Andr reduces cardiac dysfunction in vivo. (A) Representative M-mode echocardiography of left ventricular chamber in the sham, TAC, TAC + Andr 100 mg/kg and TAC Andr 200 mg/kg groups. (B) Quantification of echocardiography parameters of left ventricular-end-systolic diameter (LVESD), left-ventricular-end diastolic diameter (LVEDD), LV ejection fraction (EF) and LV shortening score (FS) at different groups of mice. **p < 0.01 and ***p < 0.001 vs. the sham group; #p < 0.05, ##p < 0.01 and ###p < 0.001 vs. the TAC group.
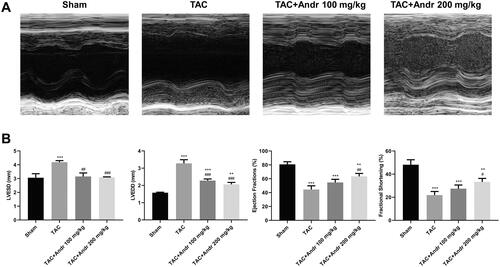
Figure 2. Andr inhibits cardiac hypertrophy in TAC mice. Serum levels of (A) brain natriuretic peptide (BNP) and (B) angiotensin II (Ang II) were determined by ELISA assay. (C) The heart weight to body weight ratios of mice in different groups. (D) Representative images of gross hearts (first panel) and H&E staining of hearts at scale bar = 1 mm (second panel) and scale bar = 50 μm (third panel) from each group of mice. (E) Quantification of cardiomyocyte size of the indicated groups. **p < 0.01 and ***p < 0.001 vs. the sham group; #p < 0.05 and ###p < 0.001 vs. the TAC group.
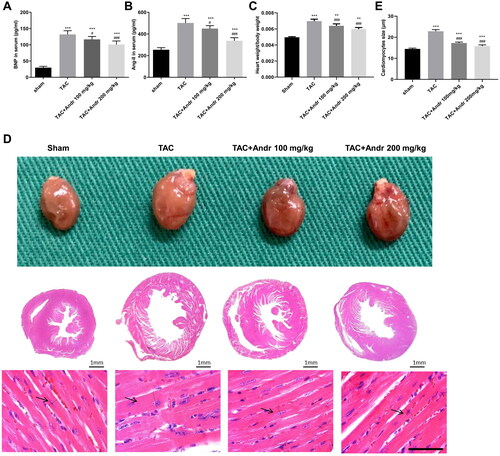
Figure 3. Andr attenuates cardiac fibrosis and reduces cardiac cell apoptosis in TAC mice. (A) Representative images of Masson’s trichrome staining of the hearts of mice in the sham, TAC, TAC + Andr 100 mg/kg and TAC Andr 200 mg/kg groups. Scale bar = 100 μm. Representative photomicrographs of TUNEL staining in the rat hearts. Scale bar = 20 μm.
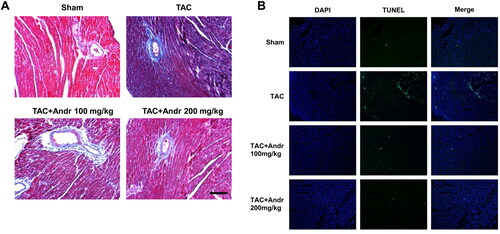
Figure 4. The effects of Andr on cardiac fibroblast in vitro. (A) Cell viability was accessed by the Cell Counting Kit-8 assay. (B–C) Western blot and (D) RT-PCR were performed to evaluate the protein and mRNA levels of β-myosin heavy chain (β-MHC), atrial natriuretic peptide (ANP) and brain natriuretic peptide (BNP) in cardiomyocytes in the indicated groups, respectively. (E) Immunofluorescence staining of F-actin and the cell surface area of cardiomyocytes in the indicated groups. The results are presented as a fold-change. ***p < 0.001 vs. the control group; #p < 0.05, ##p < 0.01 and ###p < 0.001 vs. the Ang II group, $p < 0.05, $$p < 0.01 and $$$p < 0.001 vs. the Ang II + Andr 10 μM group.
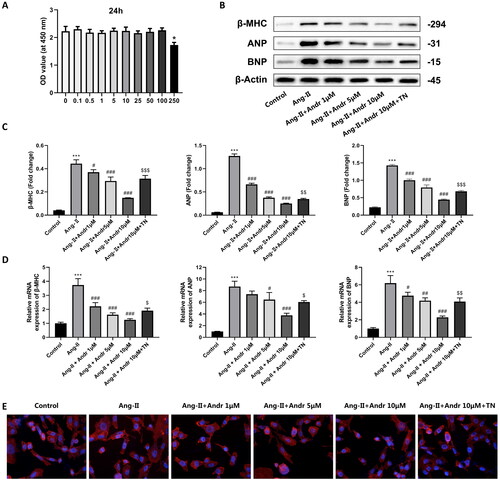
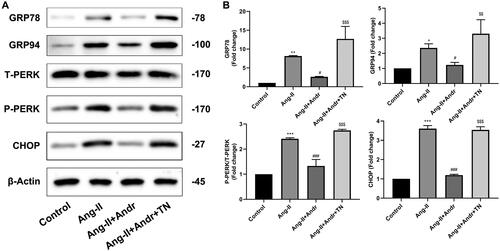
Figure 5. Andr inhibits ER stress in H9c2 cells. (A) Representative blots of GRP78, GRP94, total (T)-PERK, phosphorylated (p)-PERK and CHOP in control, Ang II, Ang II + Andr and Ang II + Andr + TN groups in H9c2 cardiomyocytes. (B) Qualifications of the Western blot assay. The results are presented as a fold change.**p < 0.01 and ***p < 0.001 vs. the control group; #p < 0.05 and ###p < 0.001 vs. the Ang II group, $$p < 0.01 and $$$p < 0.001 vs. the Ang II + Andr group.
Data availability statement
The data used to support the findings of this study are included in the article.