
Figures & data
Figure 1. Flowchart and timetable for the experiment. The LiCl–pilocarpine epilepsy model was established from day –1 to 0; tanshinone and valproate were administered from day 1 to 65; behavioural observation was performed from day 54 to 60; MWM trials were conducted from day 61 to 65. Finally, on day 65, the rats were sacrificed for mechanism research experiments. TS IIA: tanshinone IIA; VPA: sodium valproate; MWM trails: Morris water maze (MWM) trails; TEM: transmission electron microscopy.
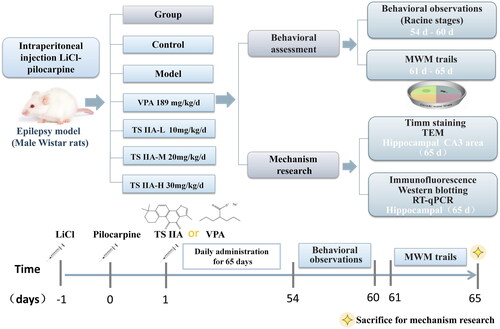
Figure 2. Effects of tanshinone IIA on the degree of seizure in LiCl–pilocarpine induced mice. (A) Stages of epileptic seizures; results of seizure severity and frequency. (B) Frequency of spontaneous recurrent seizures (SRS). SRS were recorded three times a day for one week. According to Racine stages, only the seizures of stage 3 or higher were recorded. The results are presented as mean ± SEM. ΔΔp < 0.01 vs. control; *p < 0.05, **p < 0.01 vs. model; ▲p < 0.05, ▲▲p < 0.01 vs. VPA; ##p < 0.01 vs. TS IIA-L (n = 9 per group).
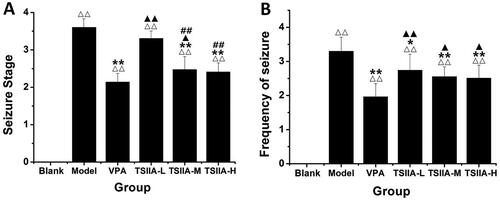
Figure 3. Effect of tanshinone IIA on ameliorates cognitive impairment in LiCl–pilocarpine-induced mice. (A) Average escape latencies. (B) Frequency crossing the platform. The results are presented as means ± SEM. Δp < 0.05, ΔΔp < 0.01 vs. control; *p < 0.05, **p < 0.01 vs. model; ▲p < 0.05, ▲▲p < 0.01 vs. VPA; ##p < 0.01 vs. TS IIA-L. (n = 10 per group).
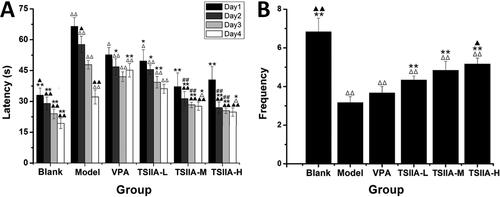
Figure 4. Effects of tanshinone IIA on mossy fibre sprouting (MFS) and ultrastructure deterioration in the hippocampus. (A) Timm staining was utilized to evaluate the effects of tanshinone IIA on MFS (×200, scale bar: 100 μm). Seizures increased granules in the stratum pyramidal or stratum oriens of the CA3 region, as indicated by the yellow arrows, with the number of arrows indicating the granule increase. Massive MFS induced by LiCl–pilocarpine was mitigated by tanshinone IIA treatment. (B) Transmission electron microscopy was utilized to assess ultrastructure damage (×20,000, scale bar: 0.5 μm). As indicated by the yellow arrows, seizures increased vacuolar degeneration in the CA3 region, and the number of arrows reflected the quantity and degree of vacuolar degeneration. The treatment with tanshinone IIA enhanced the ultrastructural disorder and vacuolar degeneration (n = 6 per group).
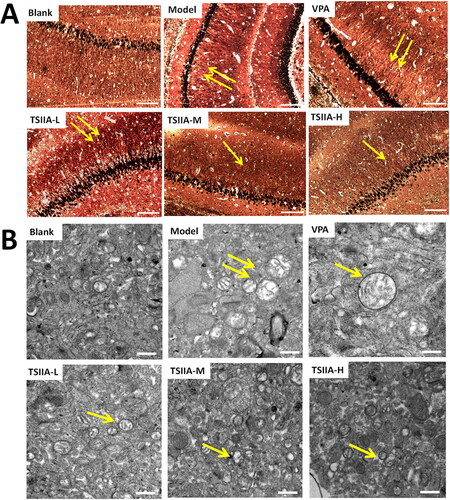
Table 1. Moss fibre germination (MFS) score of each group in the Timm staining.
Figure 5. Immunofluorescence study of tanshinone IIA's effect on hippocampus SYN (red) and PSD-95 (green) expression. (A) Single and double fluorescence staining (×400, scale bar: 50 μm). (B) Immunofluorescence expression results of SYN and PSD-95 were counted and analysed with Image-Pro Plus 6.0 software. Results are presented as mean ± SEM. Δp < 0.05, ΔΔp < 0.01 vs. blank; **p < 0.01 vs. model; ▲p < 0.05, ▲▲p < 0.01 vs. VPA; #p < 0.05, ##p < 0.01 vs. TS IIA-L (n = 6 per group).
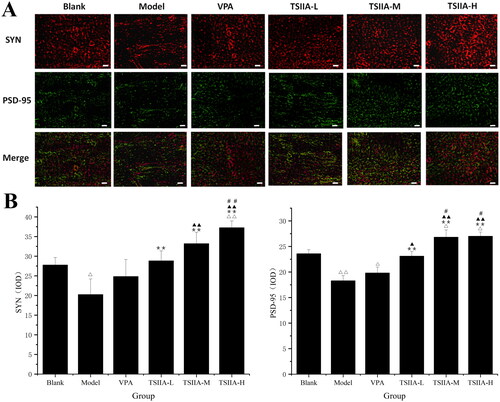
Table 2. Immunofluorescence expression results of SYN and PSD-95 protein in the hippocampi of each group.
Figure 6. Western blot study of tanshinone IIA's effect on hippocampus SYN and PSD-95 expression. (A) Western blotting was used to evaluate the protein expression of SYN and PSD-95 in the hippocampus, and β-actin was used as an internal control. (B) Densitometry analysis was performed using the Image J software. Results are presented as means ± SEM. Δp < 0.05, ΔΔp < 0.01 vs. blank; *p < 0.05, **p < 0.01 vs. model; ▲p < 0.05, ▲▲p < 0.01 vs. VPA (n = 6 per group).
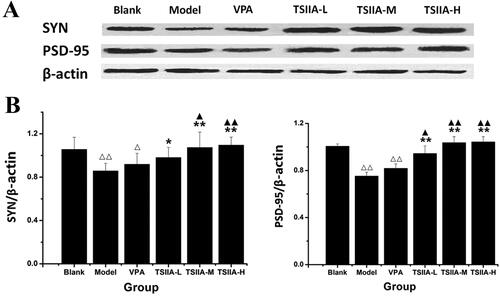
Figure 7. Effect of tanshinone IIA on SYN mRNA and PSD-95 mRNA expression in the hippocampi. (A) Relative expression results of SYN mRNA. (B) Relative expression results of PSD-95 mRNA. The results are presented as means ± SEM. Δp < 0.05, ΔΔp < 0.01 vs. control; *p < 0.05, **p < 0.01 vs. model; ▲p < 0.05, ▲▲p < 0.01 vs. VPA; ##p < 0.01 vs. TS IIA-L (n = 3 per group).
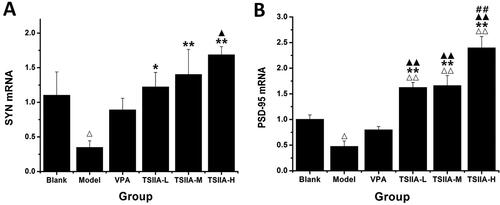
Table 3. Relative expression of SYN and PSD-95 mRNA in the hippocampi of each group.