Figures & data
Table 1. List of primers used in this study.
Figure 1. α-MG protected against high-fat/high-glucose/low-dose streptozotocin (HF/HG/STZ) induced-insulin resistance (IR) rats on hepatic manifestations such as the reduced liver lipid levels, improved liver function tests, and improved protein expression of insulin receptor substrate (IRS)-1 and phosphoinositide 3-kinase (PI3K) in the liver tissues of IR rats. The levels of liver cholesterol total (A), liver triglyceride (B), AST level in serum (C), ALT level in serum (D), protein expression of IRS-1 in the liver tissues (E), and protein expression of PI3K in the liver tissues (F). N: normal group, N + α-MG 200: normal-treated α-MG at a dose of 200 mg/kg/day group, IR: vehicle-treated insulin resistance (IR) group, IR + Met: metformin-treated insulin resistance group, IR + α-MG 100: α-MG at a dose of 100 mg/kg/day-treated insulin resistance group, IR + α-MG 200: α-MG at a dose of 200 mg/kg/day-treated insulin resistance group. Values are mean ± SD (n = 6). **p < 0.01 vs. N; §§p < 0.01 vs. N + α-MG 200; ††p < 0.01 vs. IR.
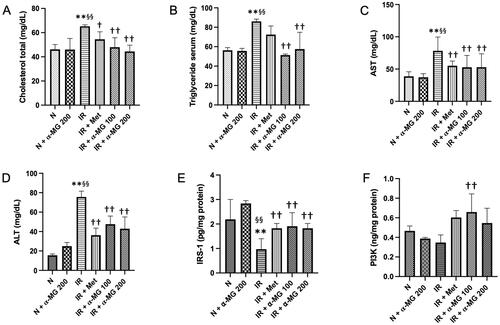
Table 2. Biochemical parameters.
Figure 2. α-MG regulates high-fat/high-glucose/low-dose streptozotocin (HF/HG/STZ) induced-IR rats on inflammation process in the liver tissues. Effect of α-MG on: (A) gene expression of Bax in the liver tissues, (B) gene expression of TNF- α in the liver tissues, (C) protein expression of TNF- α in the liver tissues, (D) gene expression of IL-1β in the liver tissues, and (E) protein expression of IL-6 in the liver tissues. Values are mean ± SD (n = 6). *p < 0.05 vs. N; **p < 0.01 vs. N; §p < 0.05 vs. N + α-MG 200; §§p < 0.01 vs. N + α-MG 200; †p < 0.05 vs. IR; ††p < 0.01 vs. IR.
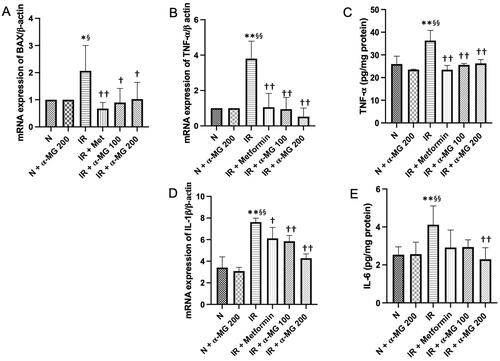
Figure 3. α-MG increased the expression of AMPK and decreased the expression of SREBP-1 and ACC. (A) Western blots p-AMPK and its relative contents, (B) protein expression of SREBP-1c in the liver tissues, and (C) protein expression of ACC in the liver tissues. Values are mean ± SD (n = 6). *p < 0.05 vs. N; **p < 0.01 vs. N; §p < 0.05 vs. N + α-MG 200; §§p < 0.01 vs. N + α-MG 200; ††p < 0.01 vs. IR.
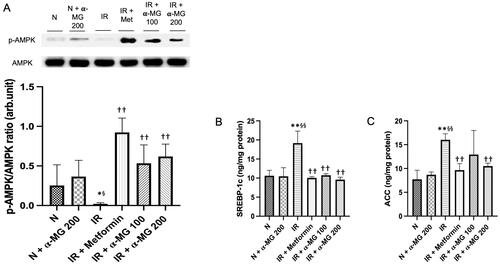
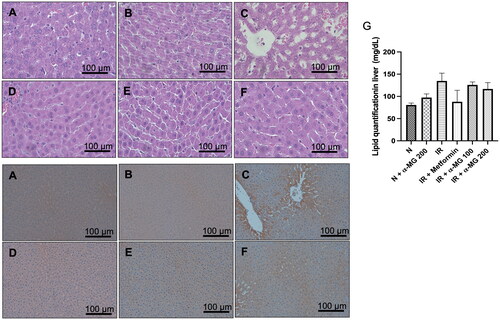
Figure 4. (A–F) Hematoxylin & Eosin staining of liver tissue. Lipid accumulation was marked in the IR group compared to other groups. Treatment with α-MG at 100 and 200 mg/kg/day markedly suppressed lipid accumulation (×400 magnification), (G) lipid quantification analysis in the liver tissues, (H–M) immunohistochemical staining with 4-HNE show lipid peroxidation with stained positive for 4-HNE (arrows). Treatment with α-MG at 100 and 200 mg/kg/day reduced 4-HNE (×200 magnification).