
Figures & data
Table 1. Primers of quantitative real-time PCR.
Figure 1. PCA ameliorated IR/D-induced increases in levels of BW/LW, serum glucose, serum insulin, and HOMA-IR in rats. (A–C) The levels of BW (A), LW (B), and BW/LW (C) in IR/D rats pretreated with PCA or not. (D and E) The levels of serum glucose (D) and insulin (E) in IR/D rats pretreated with PCA or not were examined by colorimetry and ELISA. (F) The value of HOMA-IR in IR/D rats pretreated with PCA or not. (***p < 0.001 vs. Control; +++p < 0.001 vs. Vector; ∧∧∧p < 0.001 vs. 15 mg/kg). (PCA: Protocatechuic Acid, IR/D: insulin resistance type 2 diabetic, BW: body weight, LW: liver weight).
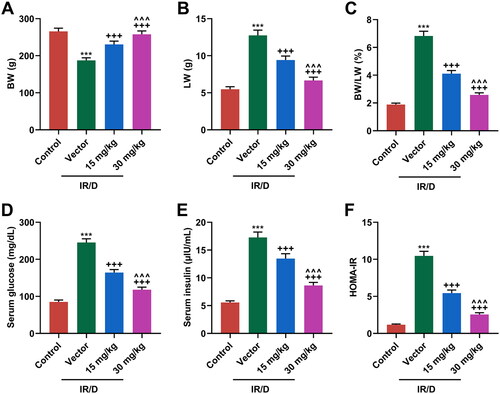
Figure 2. PCA mitigated the abnormal serum levels of liver enzymes and lipid profile in IR/D rats. (A–D) The serum lipid indexes including TC (A), TG (B), LDL (C), and HDL (D) in IR/D rats pretreated with PCA or not were examined by colorimetry assay. (E–G) In IR/D rats pretreated with PCA or not, the serum levels of liver enzymes, including AST (E), ALT (F), and ALP (G), were determined using ELISA. (***p < 0.001 vs. Control; ++p < 0.01, +++p < 0.001 vs. Vector; ∧p < 0.05, ∧∧p < 0.01 or ∧∧∧p < 0.001 vs. 15 mg/kg). (ELISA: Enzyme-linked Immunosorbent Assay, PCA: Protocatechuic Acid, IR/D: insulin resistance type 2 diabetic, TC: total cholesterol, TG: triglycerides, LDL: low density lipids, HDL: high density lipids, AST: aspartate aminotransferase, ALT: alanine aminotransferase, ALP: alkaline phosphatase).
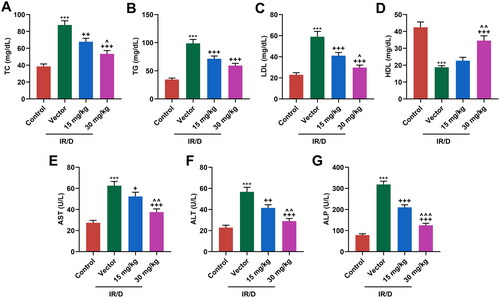
Figure 3. PCA ameliorated the oxidative stress, liver damage, and the downregulated GLP-1 in IR/D rats. (A–C) The antioxidant enzymes and oxidative stress markers including GSH (A), SOD (B), and MDA (C) in the liver tissues of IR/D rats pretreated with PCA or not were examined by ELISA. (D–F) TNF-α, IL-1β and IL-6 in the sera of IR/D rats pretreated with PCA or not were examined by ELISA. (G) The histopathological changes in liver tissues of IR/D rats pretreated with PCA or not were also examined using hematoxylin-eosin staining. (H) Steatosis scores of the liver in different groups. (I) The GLP-1 positive cells in terminal ileum of IR/D rats pretreated with PCA or not were detected by immunohistochemistry. (***p < 0.001 vs. Control; ++p < 0.01, +++p < 0.001 vs. Vector; ∧p < 0.05, ∧∧p < 0.01 or ∧∧∧p < 0.001 vs. 15 mg/kg). (ELISA: Enzyme-linked Immunosorbent Assay, PCA: Protocatechuic Acid, IR/D: insulin resistance type 2 diabetic, GSH: glutathione, SOD: superoxide dismutase, MDA: malondialdehyde, GLP-1: glucagon‐like peptide-1, TNF-α: tumor necrosis factor α).
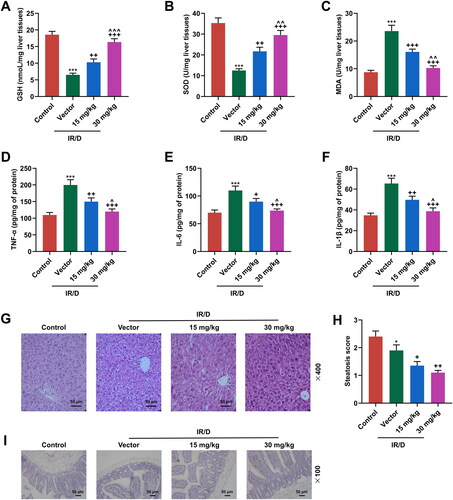
Figure 4. PCA regulated the protein expression of factors related to the NF-κB and Wnt1/β-catenin pathways in liver tissues of IR/D rats. (A–F) The protein expression of GLUT4, NF-κB, Wnt1, β-catenin, and IL-1β in the liver tissues of IR/D rats pretreated with PCA or not was measured by Western blot. (***p < 0.001 vs. Control; +p < 0.05, ++p < 0.01, +++p < 0.001 vs. Vector; ∧p < 0.05 or ∧∧p < 0.01 vs. 15 mg/kg). (PCA: Protocatechuic Acid, IR/D: insulin resistance type 2 diabetic, IL-1β: interleukin-1β, GLUT4: glucose transporter-4, NF-κB: nuclear factor kappa B).
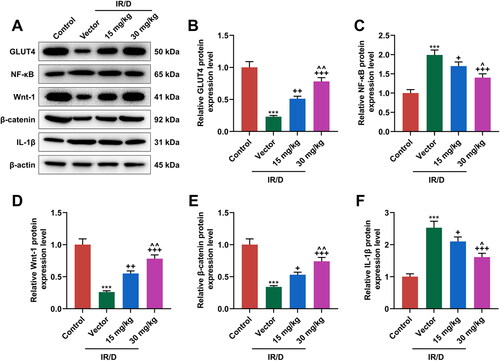
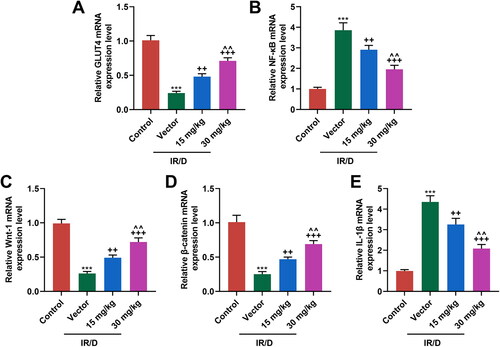
Figure 5. PCA regulated the mRNA expression of factors related to the NF-κB and Wnt1/β-catenin pathways in liver tissues of IR/D rats. (A–E) The mRNA expression of GLUT4, NF-κB, Wnt1, β-catenin, and IL-1β in the liver tissues of IR/D rats pretreated with PCA or not was quantified by qRT-PCR. (***p < 0.001 vs. Control; ++p < 0.01, +++p < 0.001 vs. Vector; ∧∧p < 0.01 vs. 15 mg/kg). (PCA: Protocatechuic Acid, IR/D: insulin resistance type 2 diabetic, qRT-PCR: quantitative real-time PCR, IL-1β: interleukin-1β, GLUT4: glucose transporter-4, NF-κB: nuclear factor kappa B).
Data availability statement
The analyzed data sets generated during the study are available from the corresponding author on reasonable request.