Figures & data
Figure 1. Effects of HU and HLF treatment on body weight and heart weight index (HW/BW). HLF ameliorated the fall in body weight induced by HU during 8 weeks (A). HLF improved the reduction in body weight after 8 weeks HU (B). HU led to a decrease in heart weight (C). HLF attenuated the increase in HWI after 8 weeks HU (D). Values are means ± SD, n = 8, *p < 0.05, **p < 0.01, ***p < 0.001.
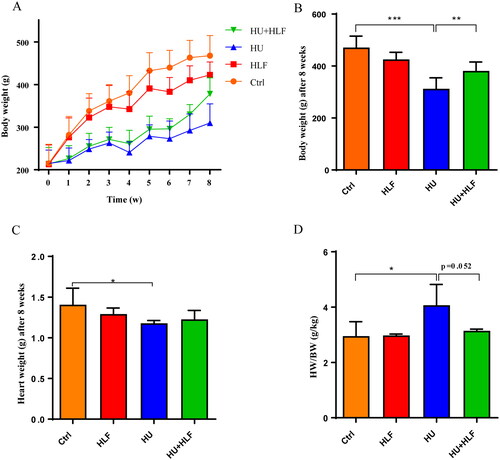
Figure 2. Changes of HU and HLF treatment in cardiac structure left ventricular function and blood pressure. (A) Representative echocardiography of four groups. (B) Left ventricular ejection fraction (LV-EF). (C) Left ventricular fractional shortening (LV-FS). (D) Left ventricular mass (LV Mass). (E) Systolic blood pressure. (F) Diastolic blood pressure. (G) Mean arterial blood pressure. Values are means ± SD, n = 8, *p < 0.05, **p < 0.01, ***p < 0.001.
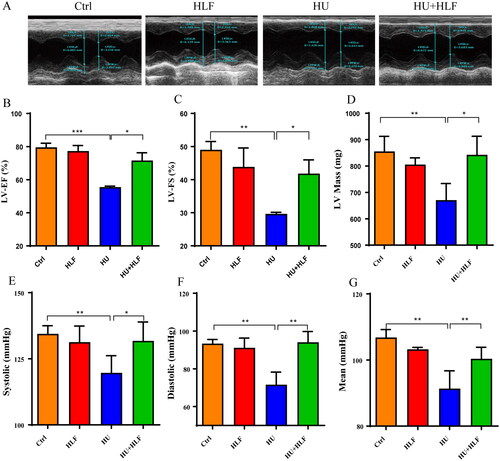
Figure 3. Concentration analyses of myocardial injury biomarkers and cardiomyocyte morphology analyses following 8 weeks HU or HLF treatment. HLF alleviated the increase in CK-MB (A) and cTnT (B) after 8 weeks HU. (C) Cardiomyocyte morphology (40×; bar = 20 μm). (D) The width of the cardiomyocyte. Values are means ± SD, n = 8, **p < 0.01, ***p < 0.001.
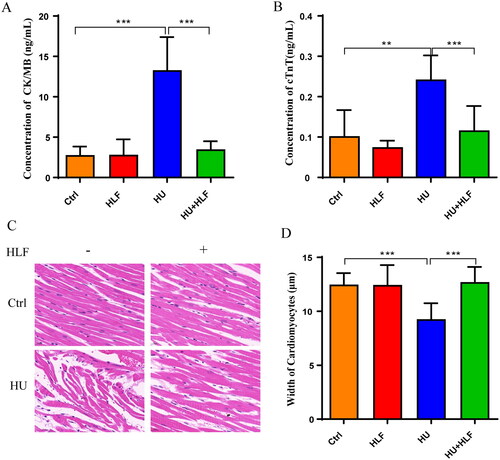
Figure 4. Signalling pathway prediction based on bioinformatics. (A) Results of the major 20 signalling pathways enrichment analysis. (B) The cGMP-PKG signalling pathway was downloaded from KEGG PATHWAY Database (https://www.kegg.jp/kegg/pathway.html).
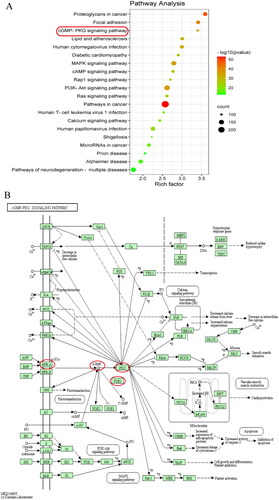
Figure 5. The major five compounds of HLF are vitexin-2″-O-rhamnoside (A), vitexin-4″-O-glucoside (B), vitexin (C), rutin (D) and hyperoside (E).
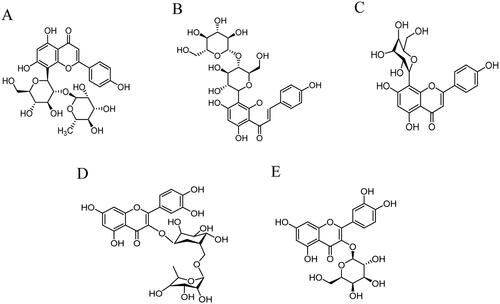
Figure 6. View of the molecular docking simulation between proteins and major compounds of HLF. (A) The binding site of PKG (PDB ID code: 4r4l) (B) Binding site of NFATc1 (PDB ID code: 5sve) (C)-(H) 2D and 3D view of the interactions between proteins and major compounds of HLF. (C) PKG and vitexin. (D) PKG and hyperoside. (E) NFATc1 and vitexin-4″-O-glucoside. (F) NFATc1 and vitexin-2″-O-rhamnoside. (G) NFATc1 and vitexin. (H) NFATc1 and hyperoside.
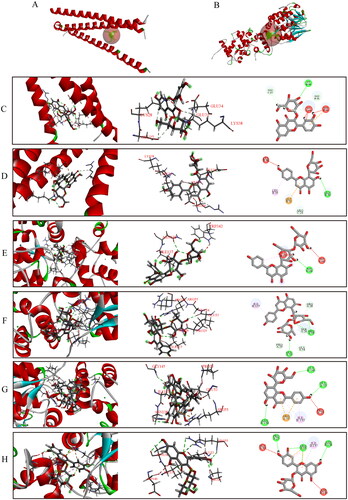
Table 1. The binding energy (kcal/mol) between compounds and target proteins.
Figure 7. HLF treatment activates NPRA-cGMP-PKG signalling pathway in rats after simulated microgravity. (A) Representative Western blots for NPRA, PKG and PDE5A in left ventricular tissue from rats after 8 weeks of HU. (B-D) Quantification analysis of relative protein in A. (E) Concentration analyses of cGMP. (F) Immunohistochemistry for NPRA in myocardial tissue slices after 8 weeks of HU (10×; bar =100 μm). Values are means ± SD, n = 8, *p < 0.05, **p < 0.01, ***p < 0.001.
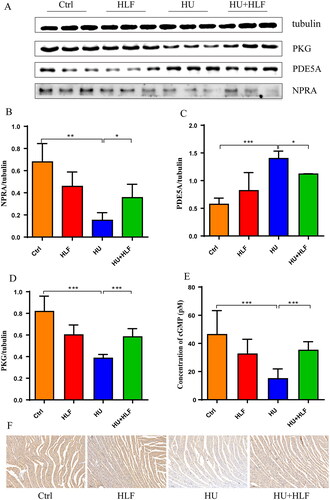
Figure 8. HLF treatment inhibits the Calcineurin-NFAT signalling pathway in rats after simulated microgravity. (A) Representative Western blots for NFATc1 and Rcan1.4 in left ventricular tissue from rats after 8 weeks of HU. (B-C) Quantification analysis of relative protein in A. (D) Immunohistochemistry for Rcan1.4 in myocardial tissue slices after 8 weeks of HU (10×; bar = 100 μm). Values are means ± SD, n = 8, *p < 0.05, **p < 0.01, ***p < 0.001.
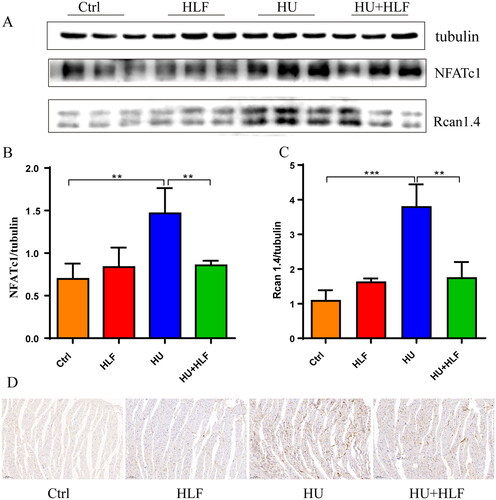
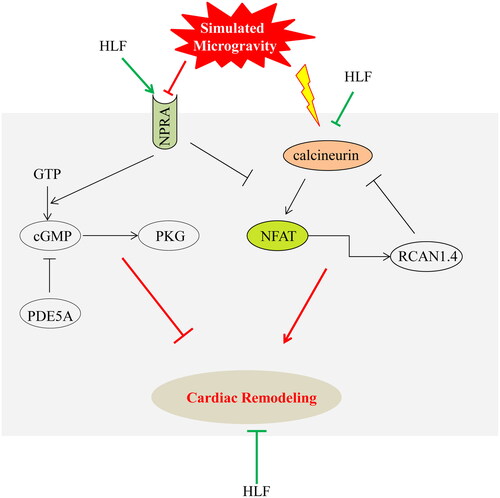
Figure 9. Mechanism of HLF protects from cardiac remodelling induced by simulated microgravity. Red represents the effect of simulated microgravity, green represents the therapeutic effect of HLF, and black represents proven effects. Arrows indicate activation, T-shapes indicate inhibition. The underlying mechanisms of HLF protective effects in simulated microgravity-induced cardiac remodeling are corresponding with the role of HLF in activating NPRA-cGMP-PKG signalling pathways and inhibiting calcineurin-NFAT signalling pathways.