
Figures & data
Table 1. The formulation designed based on simplex lattice model and the response results.
Figure 1. Acacetin solubility in selected oils, surfactants and co-surfactants.
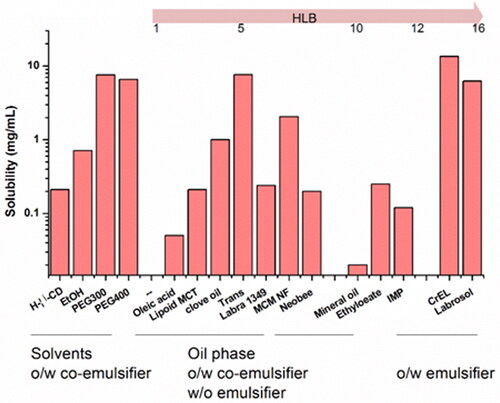
Figure 2. Pseudo-ternary phase diagrams consisted of 1349 as oil, RH40/PEG300 as Smix (a 1:1, b 2:1, c 3:1, the solid and dashed line represent the starting and ending point of the titration respectively); d comparisons of monophasic region.
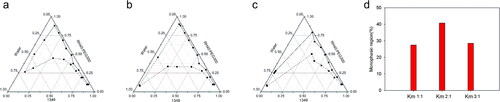
Figure 3. Pseudo-ternary phase diagrams of ME consist of 1349 (a, b) and MCF-NF (c, d, e - j) as oil, RH40/PEG300 as Smix (a, c) and RH40/Trans as Smix (b, d, e - j); (k, l) variation of the total monophasic region as a function of the surfactant to cosurfactants ratio in the system designed ME system.
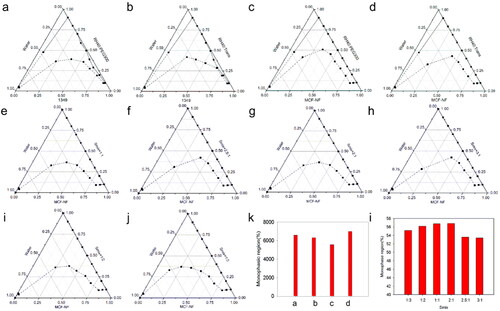
Figure 4. Reduced regression results of the observed response (a); contour plot of the effect of independent variables on the size (b), PI (c) and drug solubility (d).
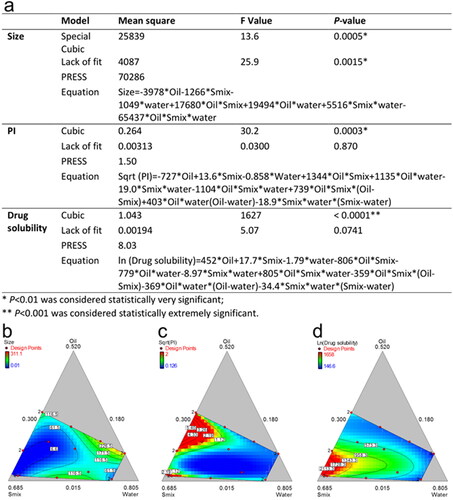
Figure 5. (a) The solubility of acacetin in different CPEs; (b) ex vivo permeation profiles of acacetin from three designed formulations. *p < 0.05, **p < 0.01, ***p < 0.001 statistically significant compared with FA; #p < 0.05, ##p < 0.01 statistically significant compared with FB.
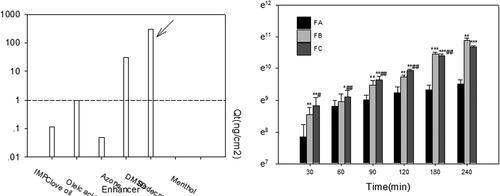
Figure 6. Mean plasma concentration profiles of acacetin after transdermal administration of various formulations. Data were expressed with Mean ± SEM (n = 3).
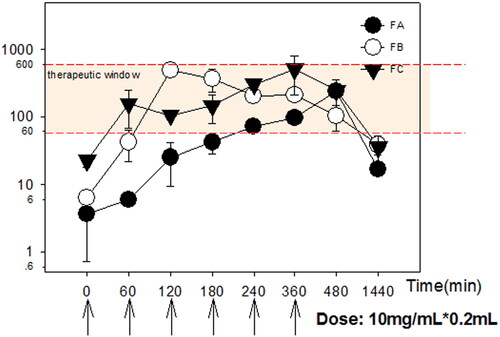
Table 2. The permeation and pharmacokinetic parameters of Acacetin after transdermal administration of different formulations at a dose of 8 mg/kg every 60 min within 360 min (n = 3).
Table 3. Physic-chemical parameters of Acacetin and phosphate prodrug of Acacetin.