
Figures & data
Figure 1. Baicalin alleviates the symptoms of PCOS in rats. (A–D) The levels of free testosterone, total testosterone, LH or FSH in serum samples were detected by ELISA assay. (E) HE staining assay was performed to observe the histopathological changes in ovarian tissues. (F) The body weight of each rat was measured. (G–I) RT-qPCR was performed to evaluate the levels of miR-874-3p, miR-144 and miR-145 in ovarian tissues. *p < 0.05, **p < 0.01, ***p < 0.001; n = 3.
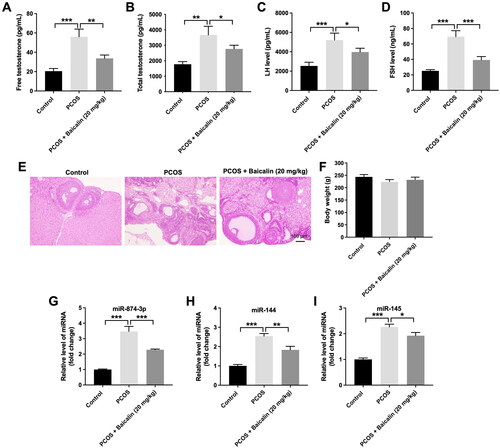
Figure 2. Baicalin inhibits the viability and proliferation of KGN cells via downregulating miR-874-3p and miR-144. (A, B) KGN cells were treated with different concentrations of baicalin. CCK-8 and TUNEL were applied to evaluate the viability and apoptosis of KGN cells. (C) RT-qPCR was used to assess the levels of miR-874-3p and miR-144 in baicalin-treated KGN cells. (D) RT-qPCR was used to determine the level of miR-874-3p in KGN cells transfected with miR-874-3p agomir. (E) RT-qPCR was used to detect the level of miR-144 in KGN cells transfected with miR-144 agomir. (F, G) KGN cells were treated with baicalin (100 µM), baicalin + miR-874-3p agomir, baicalin + miR-144 agomir or baicalin + miR-874-3p plus miR-144 agomir. CCK-8 and EdU assays were applied to evaluate the viability and proliferation of KGN cells. *p < 0.05, **p < 0.01, ***p < 0.001; n = 3.
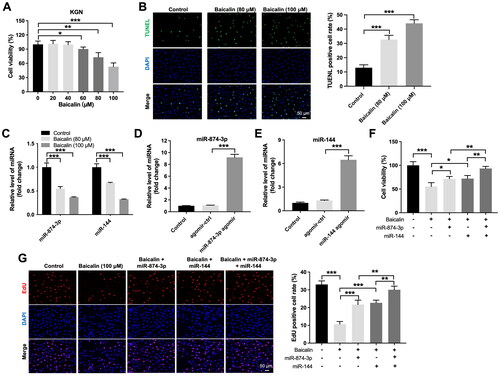
Figure 3. Baicalin induces KGN cell apoptosis via downregulating miR-874-3p and miR-144. KGN cells were treated with baicalin (100 µM), baicalin + miR-874-3p agomir, baicalin + miR-144 agomir or baicalin + miR-874-3p plus miR-144 agomir. (A and B) TUNEL was applied to evaluate the apoptosis of KGN cells. (C–E) Western blot assay was applied to evaluate Bcl-2 and cleaved caspase 3 level in KGN cells. *p < 0.05, **p < 0.01, ***p < 0.001; n = 3.
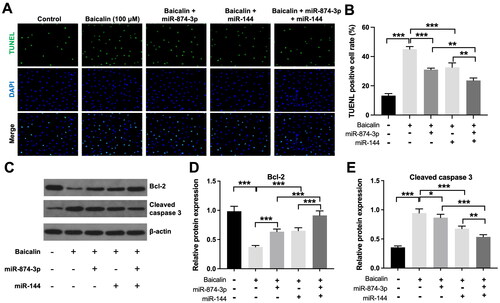
Figure 4. The potential targets of miR-874-3p and miR-144 are explored by using bioinformatics analysis. (A) Venn diagram illustrated that miR-874-3p and miR-144 had 111 common target proteins. (B) The target genes of miR-874-3p and miR-144 were analyzed by KEGG analysis. (C) Sequence alignment of miR-874-3p with the binding sites within the wild type or mutant regions of FOXO3. Sequence alignment of miR-144 with the binding sites within the wild type or mutant regions of FOXO1.
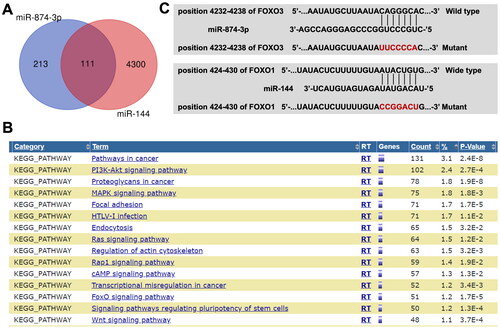
Figure 5. FOXO3 is directly targeted by miR-874-3p and FOXO1 is directly targeted by miR-144. (A) Dual-luciferase reporter assay was applied to verify relationship between potential targets (FOXO3 and FOXO1) and miRNAs (miR-874-3p and miR-144) respectively. (B) Western blot assay was applied to determine FOXO3 level in KGN cells transfected with miR-874-3p agomir. (C) Western blot assay was used to determine FOXO1 level in KGN cells transfected with miR-144 agomir. ***p < 0.001; n = 3.
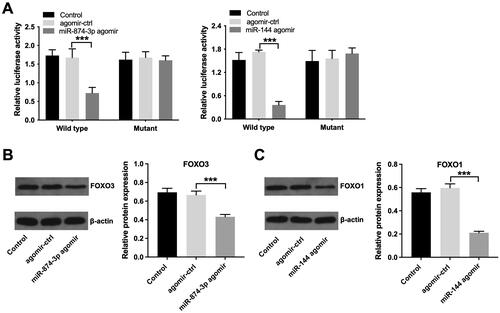
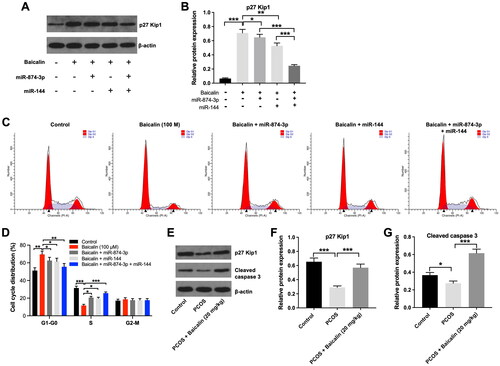
Figure 6. Baicalin induced cell cycle arrest in KGN cells via downregulating miR-874-3p and miR-144. (A and B) KGN cells were treated with baicalin (100 µM), baicalin + miR-874-3p agomir, baicalin + miR-144 agomir or baicalin + miR-874-3p plus miR-144 agomir. Western blot assay was applied to evaluate the level of p27 Kip1 in KGN cells. (C and D) Flow cytometry assay was performed to evaluate cell cycle distribution. (E, F and G) Western blot assay was used to assess the levels of p27 Kip1 and cleaved caspase 3 in ovarian tissues from PCOS rats. *p < 0.05, **p < 0.01, ***p < 0.001; n = 3.
Data availability statement
The datasets used and/or analyzed during the current study are available from the corresponding author on reasonable request.