Figures & data
Table 1. qPCR Primer design.
Figure 1. HSYA reduces lipid accumulation in the T2DM + AS model mice (A) Operation timeline of the animal experiments; (B) ApoE-/- mice were fed a high-fat diet before induction (week-4) 4 days after the injection of 30 mg/kg STZ for 3 consecutive days (week 1). the high-fat diet induction continued until the end of the experiment (week 12). Mouse FBG test results; (C-F) at the end of the experiment, the TG, TC, LDL-c, and HDL-c levels in the serum of the mice were detected (n = 8); the whole aorta was stained with G oil red O; (H) oil red O-stained frozen sections of the aortic tissue; (I) the HE staining results of the mouse aortic tissue, with blue arrows indicating lipid plaques; (J) Masson staining results of the mouse aortic tissue, plaque collagen deposition is marked with black arrows. Compared with the control group, *p < 0.05, **p < 0.01; compared with the T2DM/AS group, #p < 0.05, ##p < 0.01.
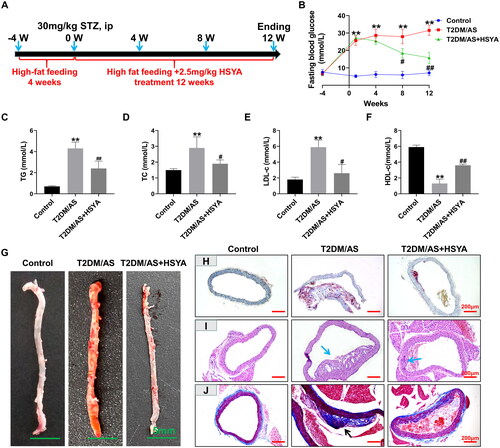
Figure 2. HSYA inhibits the expression of aortic ICAM and VCAM proteins (A) the expression intensity and distribution of ICAM and VCAM proteins in the aorta of mice in each group (n = 3) were detected by immunohistochemistry; (B andC) IPP 6.0 software was used to statistically Quantify the optical density values of the immunohistochemical detection results; (D andF) the ICAM and VCAM expression levels in the aortic tissues of the mice in each group (n = 3) were detected by western blotting, and the optical density values of the protein bands were statistically quantified using ImageJ software. **p < 0.01, *p < 0.05, compared with the control group; ##p < 0.01, #p < 0.05, compared with the T2DM/AS group; the difference was statistically significant.
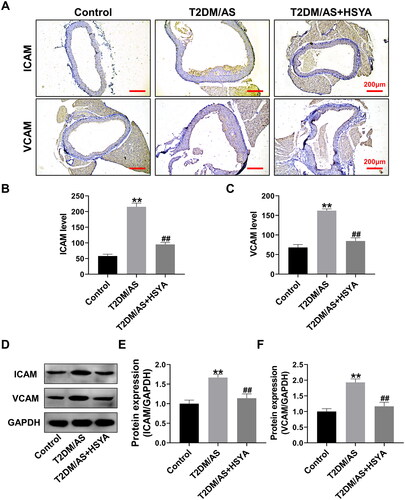
Figure 3. HSYA inhibits the occurrence of aortic ferroptosis in the T2DM + AS model mice (A–C) Biochemical detection of the GSH-Px, MDA, and ROS contents in the aortic tissue of the mice in each group (n = 4); (D) Detection of iron ion contents in the aortic tissue (n = 4); (E–H) expression levels of the ferroptosis-related proteins ACSL4, SLC7A11, and proteins in the aortic tissues of the mice in each group (n = 3) were detected by western blotting, and the optical density values of the protein bands were statistically quantified using ImageJ software. **p < 0.01, *p < 0.05, compared with the control group; ##p < 0.01, #p < 0.05, compared with the T2DM/as group; the difference was statistically significant.
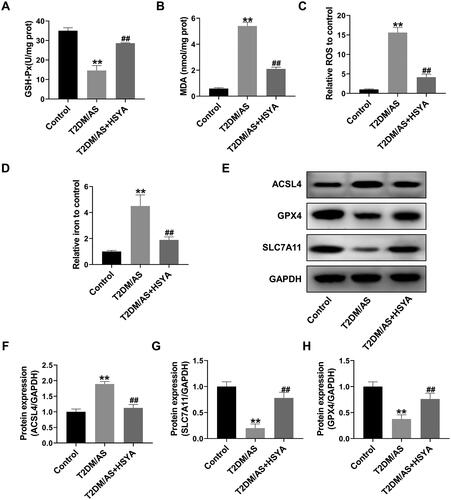
Figure 4. HSYA inhibits high glucose- and high fat-induced ferroptosis in HUVECs. (A–C) MTT assay was used to detect cell viability. (D–G) Biochemical detection of the GSH-Px, MDA, ROS, and iron ion contents in the cell Lysates (n = 3). (H) Biochemical detection of the LDH content in the supernatant of the cell culture medium (n = 3). (I-L) the protein expression levels of the ferroptosis-related proteins ACSL4, SLC7A11, and GPX4 in the cells were detected by Western blotting, and the optical density values of the protein bands were statistically quantified using ImageJ software. Compared with the control group, *p < 0.05, **p < 0.01; compared with the HG + ox-LDL group, #p < 0.05, ##p < 0.01.
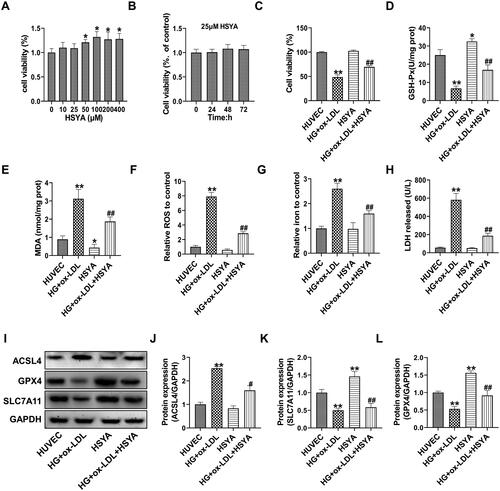
Figure 5. Screening of the miRNA-mRNA network mainly regulated by HSYA in the HUVECs induced by high glucose and high-fat treatment (A) Transcriptome analysis of a volcano plot for the distribution of the differentially expressed genes; (B) Differentially expressed genes for heatmap drawing; (C) the top 10 genes with significant differences in differentially expressed genes and the background value of treated genes >10; (D–G) qPCR was used to detect the relative expression levels of the miR-429 and SLC7A11 genes in each group in the animal and cell experiment group 1; (H) miR-429 and SLC7A11 3′-UTR gene target-binding site and mutation site sequence (red font is the target-binding site, the blue bottom panel shows the mutation sequence); (I) dual-luciferase activity test results; (J andK) the relative expression levels of the miR-429 and SLC7A11 genes were detected by qPCR. **p < 0.01, *p < 0.05, compared with the control group; ##p < 0.01, compared with the HG + ox-LDL group, the difference was statistically significant.
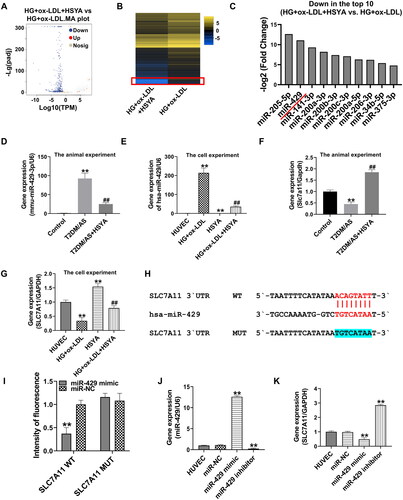
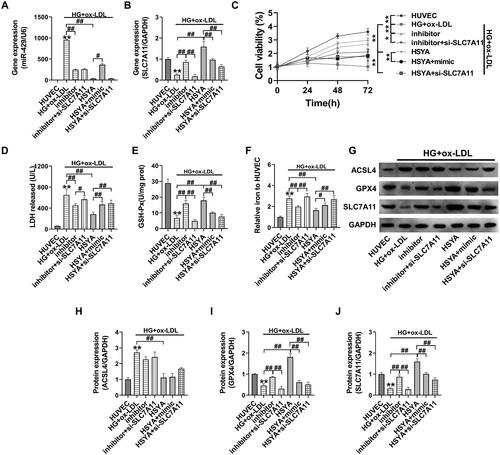
Figure 6. HSYA protects HUVECs from Ferroptotic injury via miR-429/SLC7A11 (A and B) the relative expression levels of the miR-429 and SLC7A11 genes were detected by qPCR; C the cell viability was detected by MTT; D detection of the LDH content in the cell culture supernatant; (E and F) detection of GSH-Px enzyme activity and iron ion content in the cell lysate; (G–J) the protein expression levels of the ferroptosis-related proteins ACSL4, SLC7A11, and GPX4 in the cells were detected by western blotting, and the optical density values of protein bands were statistically quantified using ImageJ software. **p < 0.01, *p < 0.05, compared with the control group; ##p < 0.01, #p < 0.05, compared with the two groups connected by the line; the difference is statistically significant.