
Figures & data
Figure 1. Drug-compounds-target network. Red node represents SCF, yellow nodes represent compound components in SCF, blue nodes represent the targets of SCF, and edges represent interactions between them.
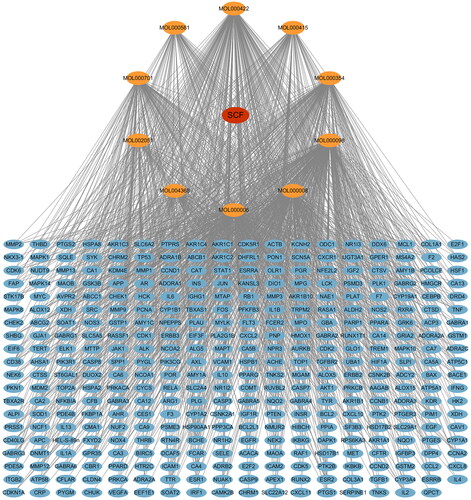
Table 1. The main component of SCF.
Figure 2. Venn diagram of SCF-MI intersection target. The pink and yellow represent the targets of SCF, the green and yellow represent the targets of MI, and the yellow represents the intersection targets.
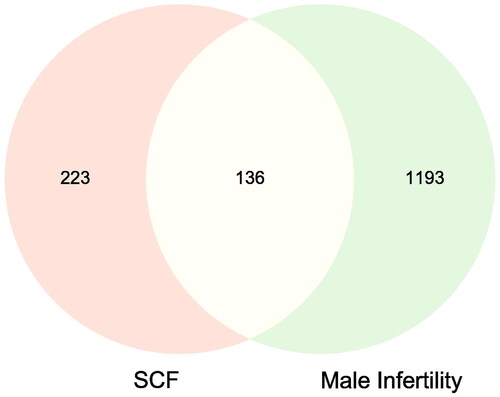
Figure 3. (A) Network biology analysis for PPI constructed with potential targets of SCF against MI. Nodes represent targets and edges represent interactions between targets. The color intensity and size of a node is proportional to the value of a degree in the network. (B) The core targets of PPI network.
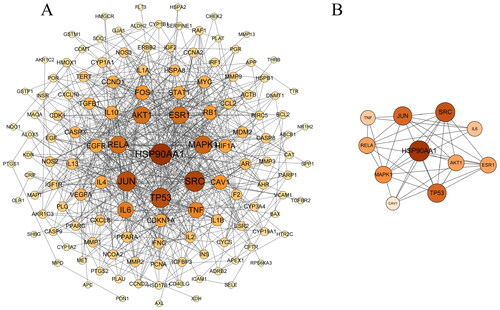
Figure 4. (A) the gene Ontology (GO) enrichment analysis. Biological process (BP), cellular component (CC), and molecular functions (MF) are enriched here. The ordinate is the project description, and the abscissa is the p values and the number of targets enriched. (B) The KEGG enrichment analysis for the potential targets of SCF against MI. The ordinate is the type of pathway and the abscissa is the number of genes enriched in a pathway.
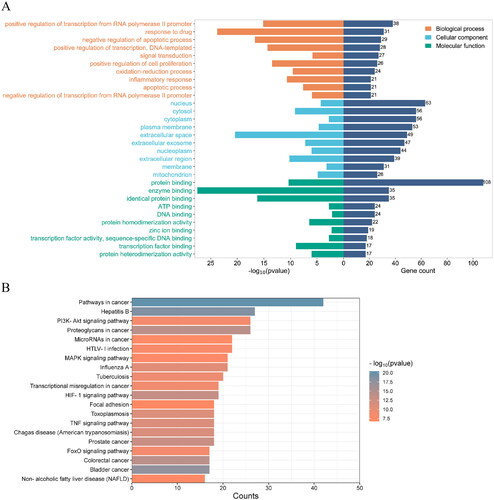
Figure 5. (A-F) The binding mode of AKT1 with MOL000098 (quercetin), MOL000701 (quercitrin), MOL000422 (kaempferol), MOL000006 (luteolin), MOL000008 (apigenin), and MOL000354 (isorhamnetin).
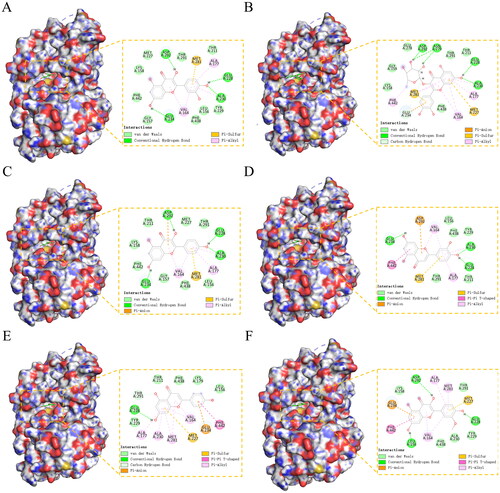
Figure 6. (A) Results of cell viability based on the MTT assay. Compared with the Control group, *p < 0.05 and **p < 0.01. Compared with the Low dose group, Δp < 0.05 and ΔΔp < 0.01. Compared with the Medium dose group, #p < 0.05 and ##p < 0.01. (B) The expression of CK-18 protein. Compared with the Control group, *p < 0.05 and **p < 0.01. Compared with the Model group, Δp < 0.05 and ΔΔp < 0.01. Compared with the Low dose group, #p < 0.05 and ##p < 0.01. Compared with the Medium dose group, Φp < 0.05 and ΦΦp < 0.01. (C) The expression of Ki67 in SCs (Original magnification: ×200, Scale bar: 50 μm DAB staining). Ki67 is expressed in the nucleus, and the brown areas in the image are Ki67 positive expression areas. The data description is the same as CK-18.
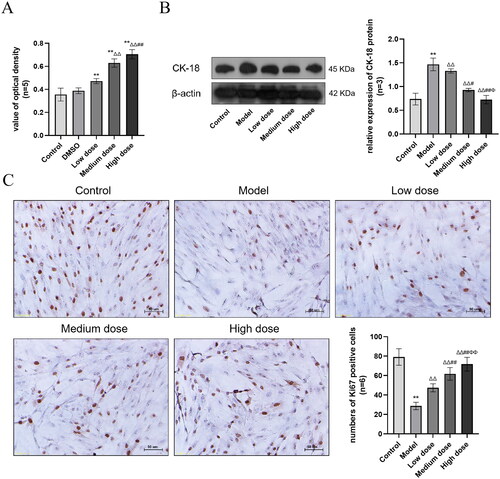
Figure 7. Compared with the Control group, *p < 0.05 and **p < 0.01. Compared with the Model group, Δp < 0.05 and ΔΔp < 0.01. Compared with the Low dose group, #p < 0.05 and ##p < 0.01. Compared with the Medium dose group, Φp < 0.05 and ΦΦp < 0.01.
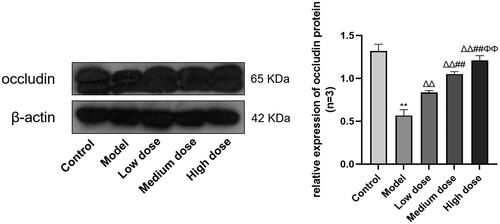
Figure 8. The expression of AR. (B) The expression of p-AKT. Compared with the Control group, *p < 0.05 and **p < 0.01. Compared with the Model group, Δp < 0.05 and ΔΔp < 0.01. Compared with the Low dose group, #p < 0.05 and ##p < 0.01. Compared with the Medium dose group, Φp < 0.05 and ΦΦp < 0.01. (C) The expression of AR in SCs (Original magnification: ×200, Scale bar: 50 μm DAB staining). AR is expressed in the nucleus, and the brown areas in the image are AR positive expression areas.
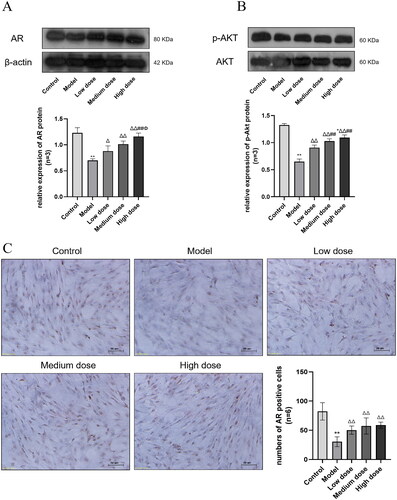
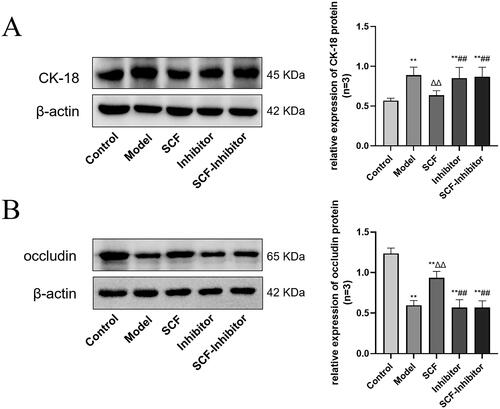
Figure 9. Effects of SCF on the expression of CK-18 and occludin after applying AKT inhibitors. Except the normal group and the inhibited group, the other groups were modeled with heat stress. (A) The expression of CK-18 protein. (B) The expression of occludin protein. Compared with the Control group, *p < 0.05 and **p < 0.01. Compared with the Model group, Δp < 0.05 and ΔΔp < 0.01. Compared with the SCF group, #p < 0.05 and ##p < 0.01.
Data availability statement
The datasets used and/or analyzed during the current study are available from the corresponding author on reasonable request.