
Figures & data
Figure 1. Indirubin treatment alleviates DSS-induced colitis in mice. (A) Schematic graph of experimental design. (B) Effect of indirubin treatments on body weight of DSS-induced colitis. (C) Effect of indirubin treatments on disease activity index (DAI) of colitis in mice. DAI was calculated by the average score of body weight loss, stool consistency and hematochezia. (D) The representative images of collected colons showed a shortened colon in the DSS group which was ameliorated by indirubin and SASP (positive control) treatments. (E) Statistics of colon length. Data are presented as Mean ± SD (n = 7). *P < 0.05, **P < 0.01 compared to the DSS group. ##P < 0.01, ###P < 0.001 in comparison between DSS and NC groups.
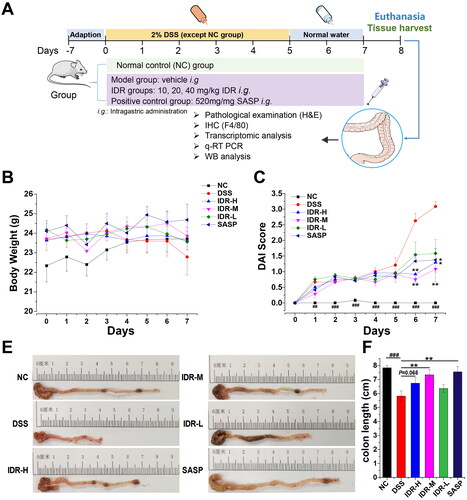
Figure 2. Indirubin treatment alleviates histological damage and macrophage infiltration of colonic tissue in mice. (A–C) Effect of indirubin (20 mg/kg) on colonic histological observations in DSS-treated mice. The representative images of colonic H&E staining were shown. (D) The histological score was calculated by a semi-quantitative grading method. Data are presented as Mean ± SD (n = 7). *P < 0.05, **P < 0.01 compared to the DSS group. (E-G) Effect of indirubin (20 mg/kg) treatment on macrophage infiltration. The representative images with immunohistochemical staining of F4/80 followed by hematoxylin counterstaining were shown. (H) The macrophages per 10 foci were counted. Data are presented as Mean ± SD (n = 7). *P < 0.05, **P < 0.01 compared to the DSS group.
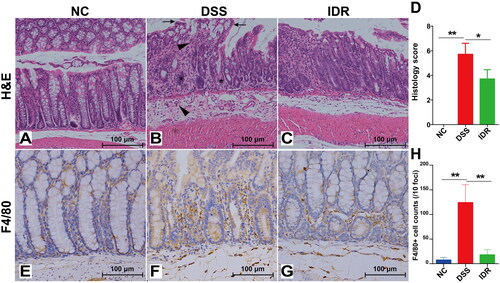
Figure 3. Comparative transcriptomic analysis of colonic tissue between DSS and NC groups. (A) Volcano diagram of differential expressed genes (DEGs) between DSS and NC groups. (B) A heatmap of DEGs between DSS and NC groups. Red and green represent the upregulated and downregulated genes, respectively. (C) Protein-protein interaction (PPI) network based on DEGs. Heat shock protein family (purple), NLRP3-IL-1β-chemokines (orange), and Hp-Hb (reg) were clustered and highlighted with different text colours. (D) The Top 20 enriched functional KEGG pathways were predicted based on DEGs. (E) Transcription factor (TF) analysis of DEGs. (F) The proportion of different types of alternative splicing (AS) with differential events between NC and DSS groups. AS, alternative splicing. JC, junction count. SE, skipped exon. RI, retained intron. MXE, mutually exclusive exon. A5SS, alternative 5′ splice site (junctions start inside an exon and end up with the initiation site of another exon). A3SS, alternative 3′ splice site (junctions start from an exon termination site and end up inside another exon). (G) The top 20 enriched KEGG pathways were predicted based on differential events of AS.
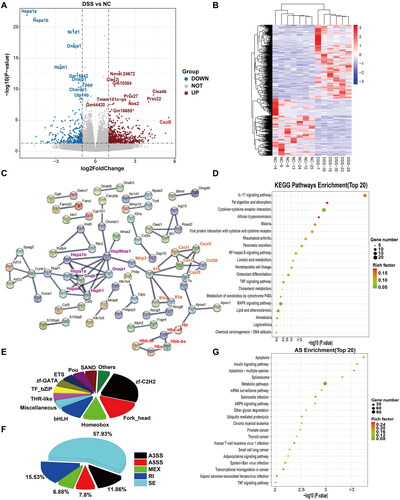
Figure 4. Comparative transcriptomic analysis of colonic tissue between IDR and DSS groups. (A) Volcano diagram of differential expressed genes (DEGs) between IDR and DSS groups. (B) A heatmap of DEGs between IDR and DSS groups. Red and green represent the upregulated and downregulated genes, respectively. (C) Protein-protein interaction (PPI) network based on DEGs. NLRP3-IL-1α/β-Cyp1a1/Cyp2e1 (orange), Adipoq-Apob-Scd1, and Hb family (reg) were clustered respectively and highlighted with different text colours. (D) The Top 20 enriched functional KEGG pathways predicted based on DEGs. (E) Transcription factor (TF) analysis of DEGs. (F) The proportion of different types of alternative splicing (AS) with differential events between IDR and DSS groups. AS, alternative splicing. JC, junction count. SE, skipped exon. RI, retained intron. MXE, mutually exclusive exon. A5SS, alternative 5′ splice site (junctions start inside an exon and end up with the initiation site of another exon). A3SS, alternative 3′ splice site (junctions start from an exon termination site and end up inside another exon). (G) The top 20 enriched KEGG pathways were predicted based on differential events of AS.
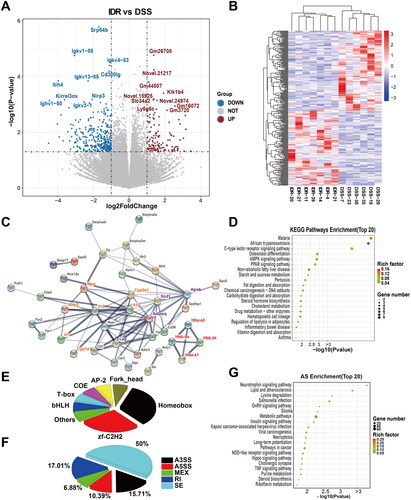
Figure 5. Colonic expression levels of Cyp1a1 and pro-inflammatory cytokines. (A) Expression levels of colonic Cyp1a1 mRNA represented by CT values (Geomean ± S.E.M). (B) Il17a mRNA relative folds (Mean ± SD, normalized to Gapdh). (C) The representative images of Western blot analysis of NLRP3, IL-1β, and NF-κB p65. (D)-(F) The optical density of NLRP3, IL-1β, and NF-κB p65 were semi-quantified and normalized to beta-actin. (G) The representative images of Western blot analysis of HBA. (H) The optical density of HBA. Data are presented as Mean ± SD (n = 7). *P < 0.05, **P < 0.01. (I) The representative images of Western blot analysis of 4-HNE. (J)The optical density of 4-HNE. Data are presented as Mean ± SD (n = 7). *P < 0.05, **P < 0.01.
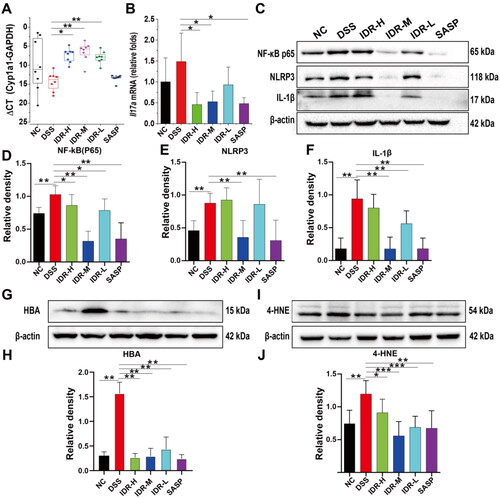
Table 1. Altered expression of AhR Target genes based on the read count with transcriptomic analysis.
Supplemental Material
Download MS Word (860.1 KB)Data availability statement
The data that support the findings of this study are available from the corresponding author upon request.