Figures & data
Figure 1. (A) Venn Diagram of common targets of ZYD and SS. (B) Compound-target network of ZYD. The network consists of 12 compounds (oval) and 32 hub genes (triangle), including 7 compounds in Xuanshen (sky-blue oval), 2 components in Maidong (yellow oval), 3 compounds in Shengdi (red oval) and 32 targets (purple triangle).
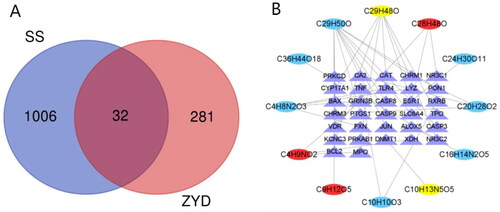
Table 1. 29 active compounds of ZYD.
Figure 2. (A) Protein-protein interaction network of ZYD anti-SS. (B) The top 20 genes of the PPI network. The longitudinal-axis displays gene name, and horizontal axis represents the number of these genes.
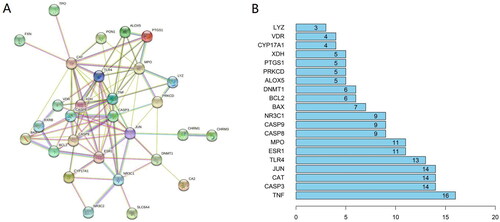
Figure 3. GO enrichment analysis for 32 common genes in BP (A), CC (B), and MF (C). (D)KEGG pathway enrichment analysis. The longitudinal-axis of these bar graphs represents GO terms (A–C) or KEGG pathway name (D), and horizontal-axis represents the number of genes enriched in each GO terms. The color of the column represents the significance of enrichment: the redder the color, the more significant the enrichment of these genes.
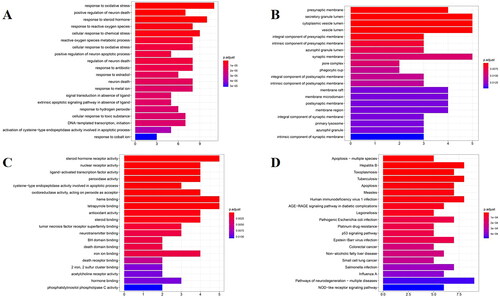
Figure 4. Apoptosis-multiple species signaling pathway of ZYD in treating SS.
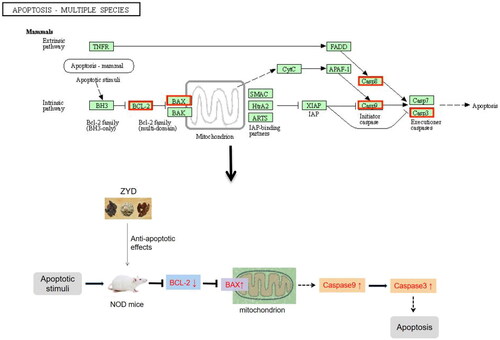
Figure 5. The pathway-target network of ZYD anti-SS. Pathways are shown as red fusiform, and target genes are shown as orange rectangle. The size of a node is proportional to the value of a degree.
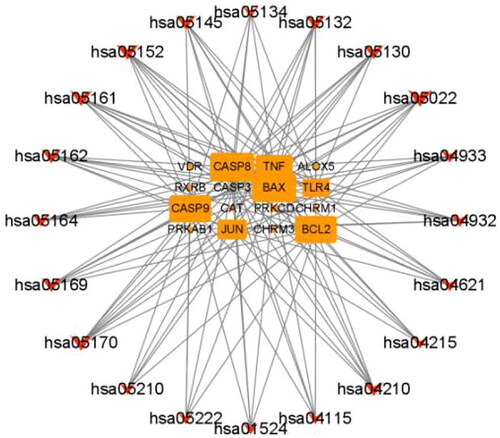
Table 2. KEGG pathway and targets enriched in each pathway.
Figure 6. The molecular docking Models. (A) β-sitosterol and BAX. (B) β-sitosterol and CASP3. (C) stigmasterol and BAX. (D)stigmasterol and CASP3.
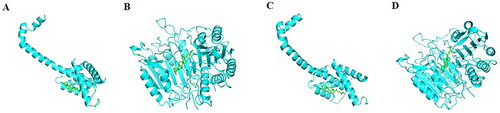
Table 3. The molecular docking Scores of primary components and key targets (kcal/mol).
Figure 7. Water consumption and salivary secretion in mice. ##p < .01 compared with the control group; **p < .01 compared with the model group.
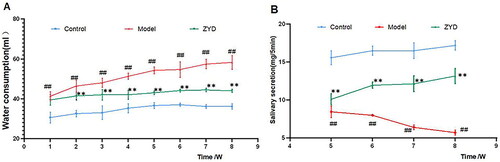
Figure 8. (A) HE staining of SMG tissues sections in mice (Magnification 200×). (B) Histological score of SMG tissues sections. ##p < .01 compared with the control group; **p < .01 compared with the model group.
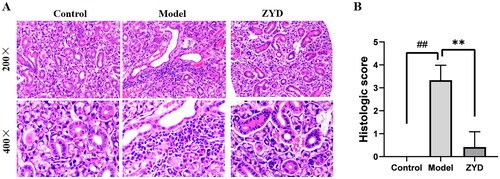
Figure 9. (A–D) the level of serum inflammatory cytokines TNF-α, IL-1β, IL-6, and IL-17 in mice. ####p < .0001 compared with the control group. ****p < .0001 compared with the model group.
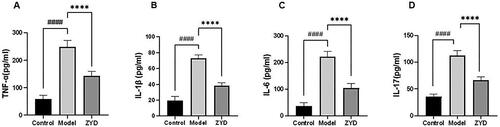
Figure 10. (A) Western blotting was used to detect the expression of Bcl-2, Bax and Caspase3 proteins in mice. (B–D) The level of relative expression of Bcl-2, Bax, and Caspase3. ##p < .01 and ###p < .001 compared with the control group. *p < .05 and **p < .01 compared with the model group.
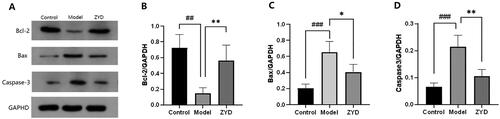
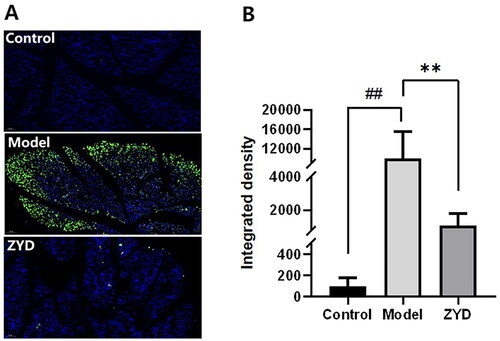
Figure 11. (A) Representative TUNNEL staining images of SMG epithelial cells sections in mice magnified 200 times, with green fluorescence indicating the apoptotic cells. (B) The fluorescence quantification of TUNNEL staining. ##p < .01 compared with the control group. **p < .01 compared with the model group.