
Figures & data
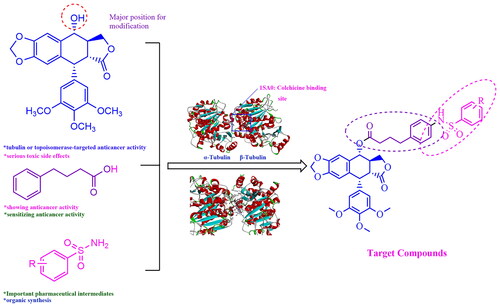
Figure 1. Structures of podophyllotoxin, 4-phenylbutyrate, ABT-751, and their analogues.

Figure 2. Design of the target compounds.
Scheme 1. Synthesis of podophyllotoxin derivatives E1-E16. Reagents and reaction conditions: (a) room temperature; (b) (1) H2O, saturated Na2CO3, pH 8-9, room temperature, 2 h; (2) 1 M HCl, pH 1-2; (c) DCC, DMAP, CH2Cl2, 0 °C, 8 h.
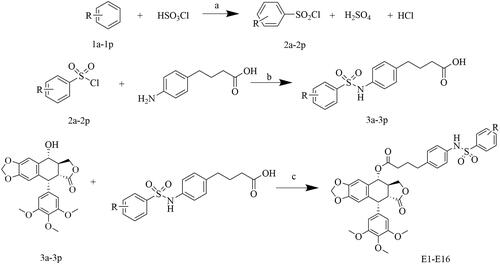
Table 1. Eluent composition and proportion.
Figure 3. Interaction binding energy between compounds E1-E16 and PPT.
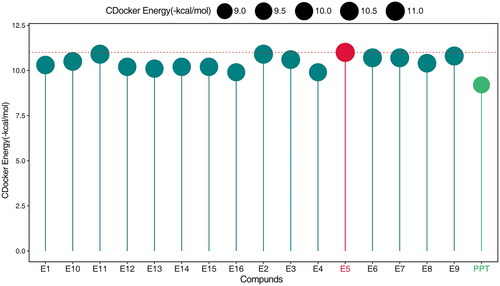
Table 2. The structure of the compound E1-E16.
Table 3. Antiproliferative activity in vitro.
Figure 4. Compound E5 binding mode at the tubulin colchicine site (PDB code: 1SA0) and compound E5 induced arrest of S and G2/M in A549 cells. (A) 2D image of the interaction between E5 and amino acid residues of the nearby active site. (B) 3D image of E5 was inserted into the tubulin binding site. (C and D) Flow cytometry analysis of E5 in a dose-dependent and time-dependent manner. (E) quantitative analysis. *p < 0.05 and **p < 0.01 vs. vehicle group.
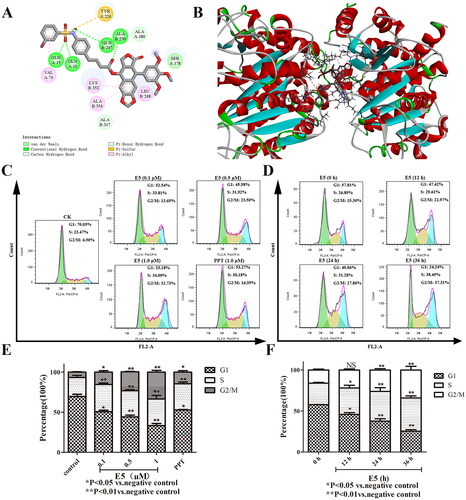
Figure 5. Compound E5 induced A549 cell apoptosis. Cells were incubated with PPT (2.0 µM) and E5 (0.5, 1.0, and 2.0 µM) for 24 h, and also incubated with E5 (1.0 µM) for 0, 12, 24, and 36 h. (A and B) Flow cytometry analysis of E5 in a dose- and time-dependent manner using Annexin V/PI double staining. (C) Western blot for cell apoptosis-related proteins (Bax and Bcl-2) separated by SDS-PAGE, and GAPDH was used as the internal control. Data are expressed as mean ± SD. (D) quantitative analysis. *p < 0.05 and **p < 0.01 vs. vehicle group.
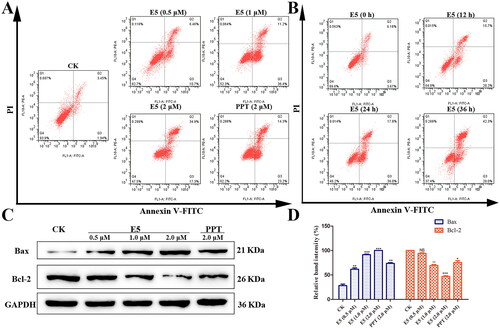
Figure 6. The mitochondrial transmembrane potential was analysed in E5-treated A549 cells by JC-1 staining. (A) Luminescence microscope analysis. (B) Flow cytometry analysis.
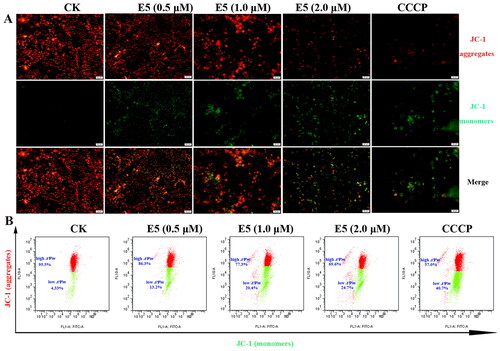
Figure 7. Effects of E5 (0.5 and 1.0 µM), etoposide (1.0 µM), and colchicine (1.0 µM) on interphase microtubules of A549 cells. (A) Tubulin was tagged with Cy3-labeled goat anti-mouse IgG (H + L) (red) and DAPI-stained cell nuclei (blue). Images were captured using a confocal fluorescence microscope. (B) E5 affected the assembly of microtubules in vitro. A549 cells were treated with E5 (1.0), colchicine (1.0 μM), and etoposide (1.0 μM) for 24 h, cytosolic (S, soluble) and cytoskeletal (P, polymerized tubulin) tubulin fractions were separated and immunoblotted with antibody against β-tubulin.
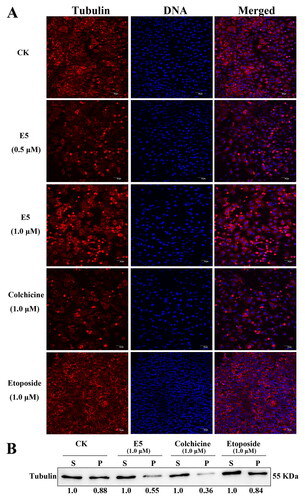
Figure 8. Wound healing migration assay and transwell invasion assay of A549 cells. (A) Cells were incubated with positive drugs PPT (1.0 µM), etoposide (1.0 µM), and E5 (0.5, 1.0, and 2.0 µM) for 24 h. The images were photographed at 0 and 24 h. (B) Relative inhibition of cell migration. The percentage of inhibition was calculated relative to the control group. (C) Representative images of the transwell assay at 24 h.
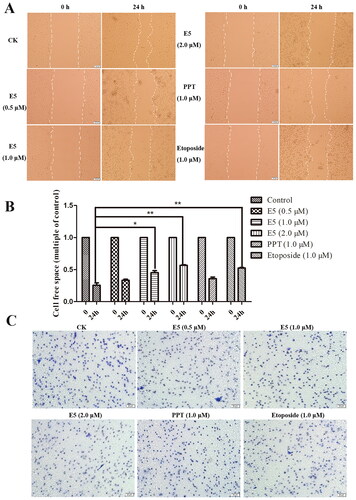
Figure 9. Binding mode of compound E5 at the colchicine site of Akt (PDB code: 3cqw) and effects of compound E5 on the PI3K/Akt signalling pathway in A549 cells. Cells were incubated with the positive drugs PPT (1.0 µM), LY294002 (1.0 µM), and E5 (0.1, 0.5, 1.0, and 2.0 µM) for 24 h. (A) 2D image of the interaction between E5 and amino acid residues of the nearby active site. (B) Relative inhibition of cell colony. (C) 3D image of E5 was inserted into the tubulin binding site. The images were photographed at 0 and 24 h. (D) Western blot analyses of PI3K, pPI3K, Akt, and pAkt proteins in A549 cells separated by SDS-PAGE and GAPDH were used as an internal control.
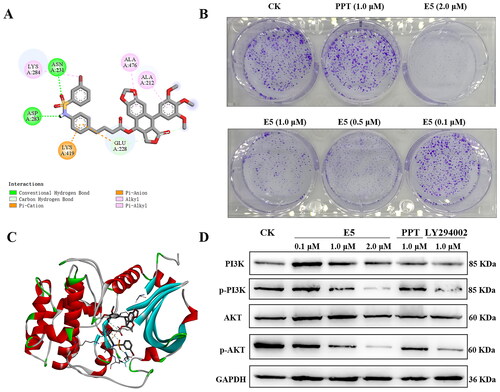
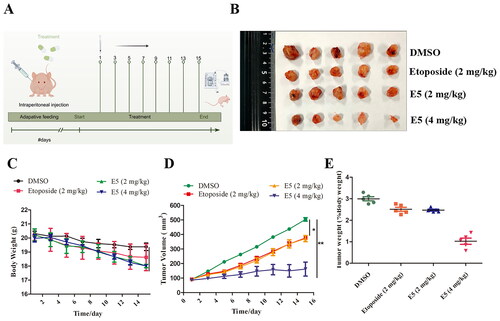
Figure 10. Compound E5 suppresses tumour growth of A549 xenografts in BALB/c nude mice. (A) Diagram of the administration pattern. (B) Tumour images were recorded after 15 days of treatment. (C and D) Body weight and tumour size were measured every two days. (E) The percentage of tumor weight was calculated.
Supplemental Material
Download TIFF Image (2.5 MB)Data availability statement
Data supporting the findings of this study are available from the corresponding author upon reasonable request.