
Figures & data
Figure 1. The total ion chromatogram of KGY.
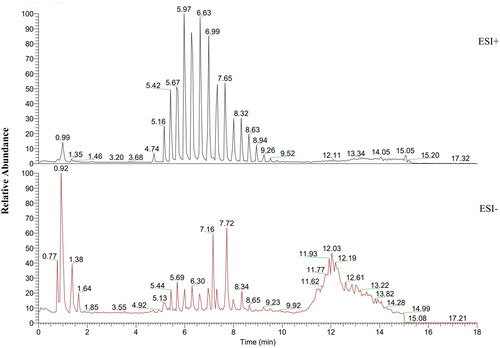
Table 1. Chemical compounds identification of Kang-Gong-Yan soft capsule.
Figure 2. KGY improves cervical tissue congestion, edema, and inflammatory cell infiltration in cervicitis rats, and decreased plasma levels of inflammatory factors, including IL-6, IL-1β and TNF-α. (A) Effects of KGY on cervical tissue of rats (vaginal opening and uterus). (H&E staining images, original magnification, ×100). (B) Uterine coefficient of rats (n = 6). (C) Cytokines in plasma (n = 6). The model group is compared with the control group, ###p < 0.001; the KGY (low/medium/high dose) groups were compared with the model group, **p < 0.01 and ***p < 0.001.
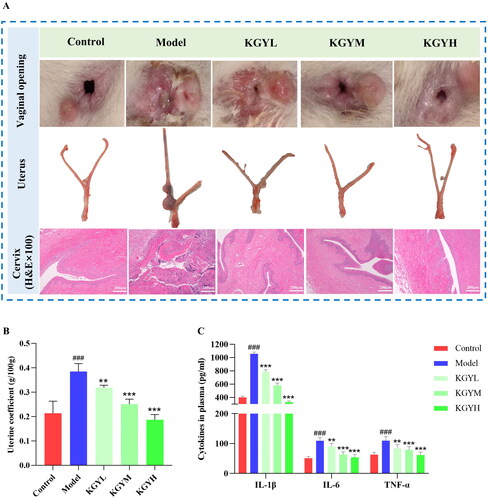
Figure 3. Metabolomics analysis. (A) OPLS-DA score plot of samples from model and KGYH groups (n = 6); permutation diagram (KGYH VS model). (B) Heatmap analysis of 15 metabolites for model and KGYH groups.
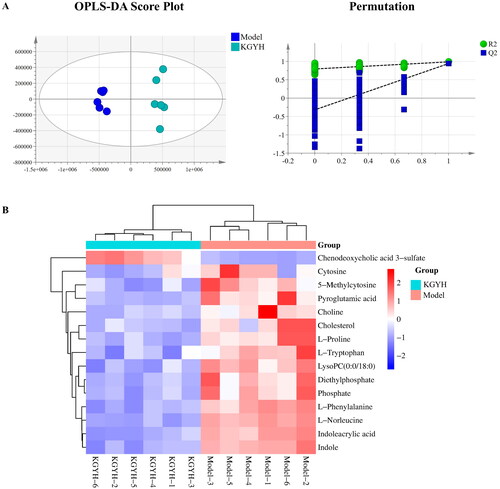
Figure 4. Analysis of metabolic pathways in the cervicitis rats with the treatment of KGY.
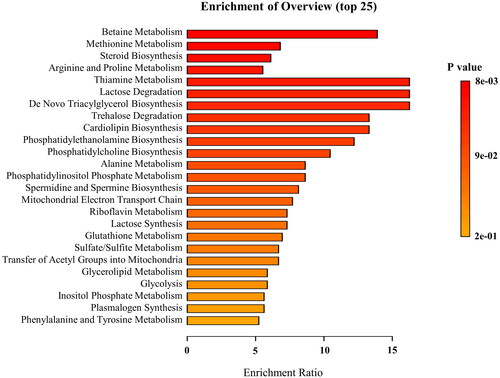
Figure 5. Gut microbiota analysis. (A) PCoA analysis of all groups. (B) The Venn diagram. (C) Alpha diversity (Shannon, Simpson, Chao1 indexes, and observed-species) of gut microbiota in each group; the model group was compared with the control group, #p < 0.05. (D) The relative abundance on phylum level (top 10). (E) The relative abundance on genus level (top 30).
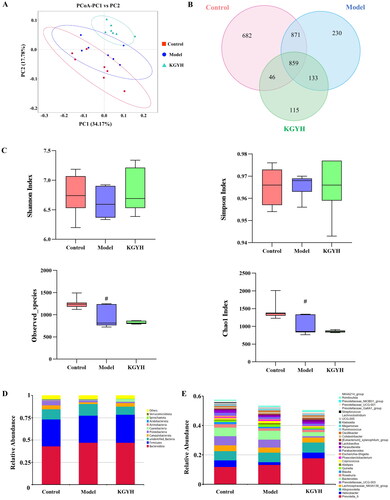
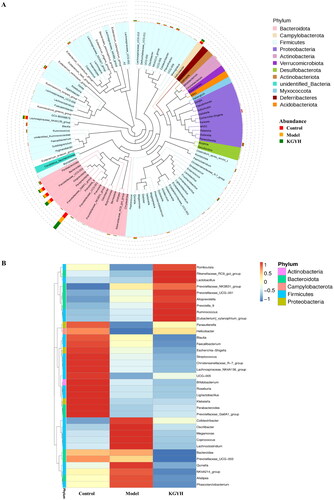
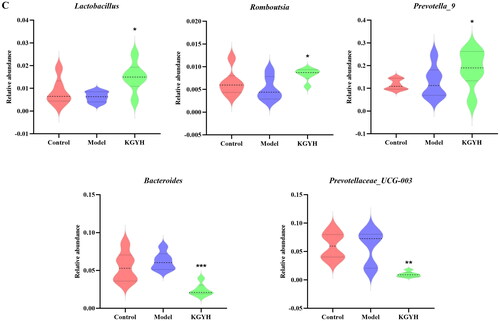
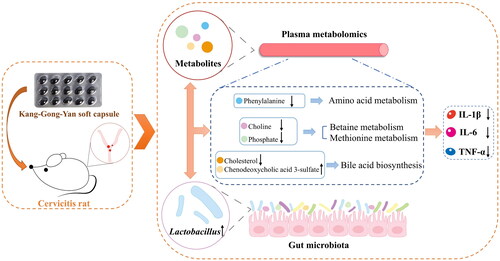
Figure 7. Schematic representation of the interaction of Lactobacillus and metabolites during the treatment of cervicitis with KGY.
Data availability statement
The datasets used and analyzed during the current study are available from the corresponding author upon reasonable request.