Figures & data
Table 1. Compounds identified in Allium cepa bulb extract.
Figure 1. Schematic diagram illustrating the therapeutic protocol for HDM/PBS challenge and OBE treatment. Mice were immunized, intraperitoneally (i.p.) on day 0 and subsequently challenged intranasally (i.n.) on days 14, 17, and 18. Treatment with OBE (i.p.) was initiated on day 18 until day 20. Mice were sacrificed on day 21.
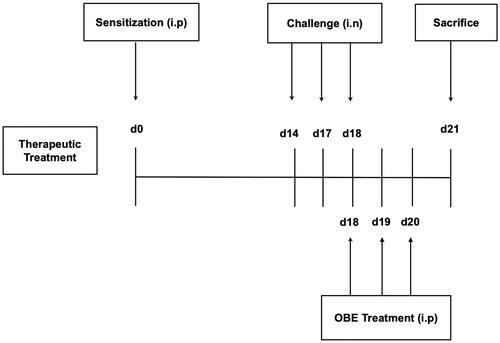
Figure 2. Schematic diagram illustrating the preventative protocol for HDM/PBS challenge and OBE treatment. Mice were immunized, intraperitoneally (i.p.) on day 0 and subsequently challenged intranasally (i.n.) on days 14, 17, and 18. Treatment with OBE (i.p.) was initiated 4 days prior to immunization and continued for four days. Mice were sacrificedon day 19.
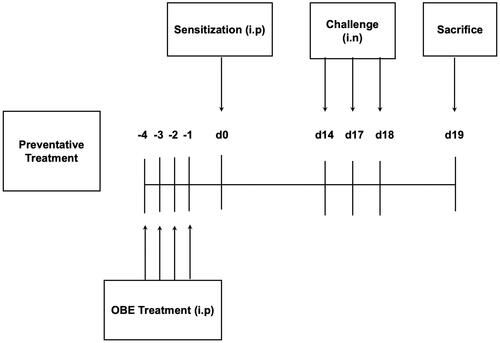
Figure 3. Effect of therapeutic OBE treatment (at dose 30, 60, and 100 mg/kg; i.p) on HDM-induced increase in (A) total cell and (B) differential cell count. Data are expressed as mean ± SEM (n = 7–11) *p < 0.05 vs. PBS and #p < 0.05 vs. HDM (Kruskal-Wallis test followed by Dunn’s multiple comparison test).
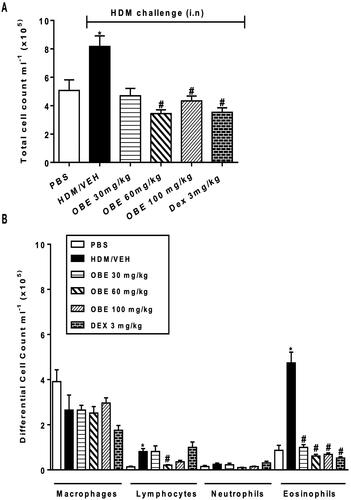
Figure 4. Effect of therapeutic OBE treatment, at a single dose of 60 mg/kg; i.p., on the HDM-induced airway inflammation and airway remodeling. Histopathological changes displaying (A) H&E and (B) PAS staining of lungs sections are shown as low-magnification light photomicrographs displaying the different treatment groups; PBS-challenged mice post-treated with vehicle (PBS group), HDM-challenged mice post-treated with vehicle (HDM group), HDM-challenged mice post-treated with OBE (60 mg/kg; i.p) (OBE group) and HDM-challenged mice post-treated with DEX (3 mg/kg; i.p) (DEX group); scale bar = 200 µm. Bar graph shows (C) cellular infiltration and (D) mucous intensity score for H&E and PAS staining, respectively. Data are expressed as mean ± SEM (n = 5–7). *p < 0.05 vs. PBS and #p < 0.05 vs. HDM (H&E- ANOVA followed by bonferroni post hoc test, PAS – Kruskal-Wallis test followed by Dunn’s multiple comparison test). Br = bronchioles. Arrows indicate peribronchial and perivascular inflammation (H&E) or significant bronchial mucus production and goblet cell hyper/metaplasia (PAS).
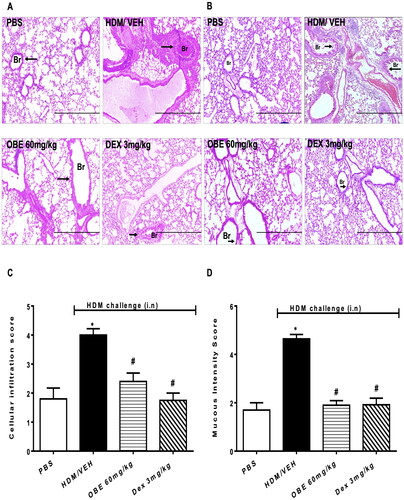
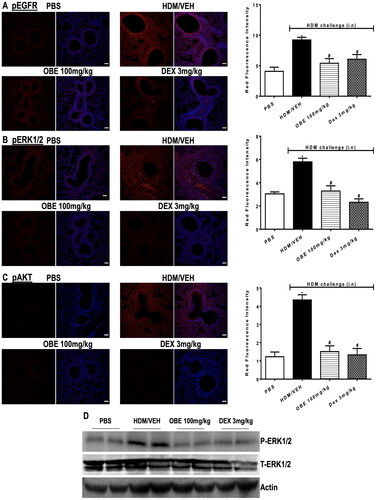
Figure 5. Effect of therapeutic OBE treatment, at a single dose of 60 mg/kg; i.p, on the HDM-induced expression of phosphorylated (A) EGFR (B) ERK1/2 and (C) AKT. Lung sections were obtained from the treatment groups; PBS-challenged mice post-treated with vehicle (PBS group), HDM-challenged mice post-treated with vehicle (HDM group), HDM-challenged mice post-treated with OBE (60 mg/kg; i.p) (OBE group) and HDM-challenged mice post-treated with DEX (3 mg/kg; i.p) (DEX group), thereafter these lung sections were immunostained for pEGFR, pERK1/2 and pAKT. The left-hand panel displays the expression of pEGFR, pERK1/2 and pAKT (red), whilst the right-hand panel displays the overlay with DAPI (blue), scale bar = 50 µm. Bar graphs represent the quantitative assessment of fluorescence intensity of pEGFR, pERK1/2 and pAKT (arbitrary units). Data are expressed as mean ± SEM (n = 4–5). *p < 0.05 vs. time-matched PBS-challenged mice, #p < 0.05 vs. HDM-challenged mice (Kruskal-Wallis test followed by Dunn’s multiple comparison test).
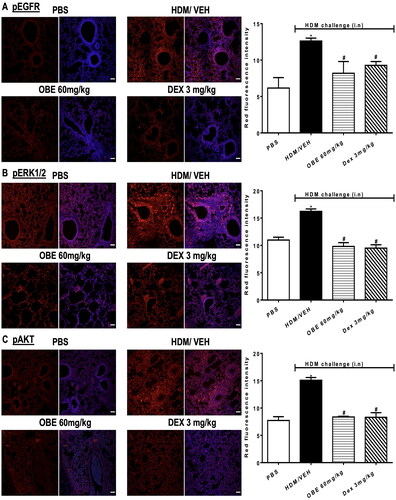
Figure 6. Effect of preventive treatment with OBE, at doses of 60 and 100 mg/kg; i.p., on the HDM-induced increase in (A) total cell and (B) differential cell count. Data are expressed as mean ± SEM (n = 8–11) *p < 0.05 vs. PBS and #p < 0.05 vs. HDM (Kruskal-Wallis test followed by Dunn’s multiple comparison test).
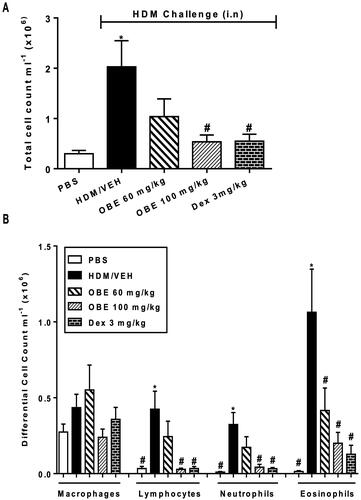
Figure 7. Effect of preventive treatment with OBE, at doses of 60 and 100 mg/kg; i.p., on the HDM-induced airway inflammation and airway remodeling. Histopathological changes displaying (A) H&E and (B) PAS staining of lungs sections from all treatment groups; PBS-challenged mice pre-treated with vehicle (PBS group), HDM-challenged mice pre-treated with vehicle (HDM group), HDM-challenged mice pre-treated with OBE (60 mg/kg; i.p) (OBE 60 group), HDM-challenged mice pre-treated with OBE (100 mg/kg; i.p.) (OBE 100 group) and HDM-challenged mice pre-treated with DEX (3 mg/kg; i.p.) (DEX group); scale bar = 200 µm. Bar graphs illustrate (c) cellular infiltration and (d) mucous intensity score for H&E and PAS staining, respectively. Data are expressed as mean ± SEM (n = 11-15). *p < 0.05 vs. PBS and #p < 0.05 vs. HDM (H&E - ANOVA followed by bonferroni post hoc test, PAS - Kruskal-Wallis test followed by Dunn’s multiple comparison test). Br = bronchioles. Arrows indicate peribronchial and perivascular inflammation (H&E) or significant bronchial mucus production and goblet cell hyper/metaplasia (PAS).
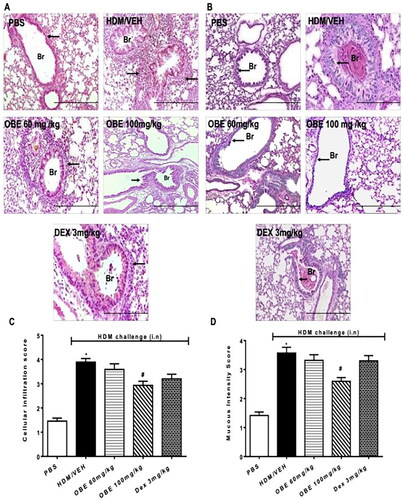
Figure 8. Effect of preventive treatment with OBE, at a single dose of 100 mg/kg; i.p., on the HDM-induced serum levels of HDM-specific IgE. The different treatment groups were; PBS-challenged mice pre-treated with vehicle (PBS group), HDM-challenged mice pre-treated with vehicle (HDM group), HDM-challenged mice pre-treated with OBE (100 mg/kg; i.p.) (OBE group) and HDM-challenged mice pre-treated with DEX (3 mg/kg; i.p.) (DEX group). Data are expressed as mean ± SEM (n = 6–11). *p < 0.05 PBS group, #p < 0.05 vs. HDM group (Kruskal-Wallis test followed by Dunn’s multiple comparison test).
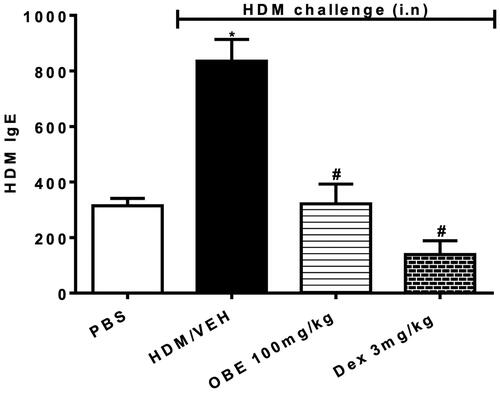
Figure 9. Effect of preventive treatment with OBE, at a single dose of 100 mg/kg; i.p, on the HDM-induced expression of various pro-inflammatory cytokines. Data are expressed as mean ± SEM (n = 3). *p < 0.05 vs. PBS group, #p < 0.05 vs. HDM group (ANOVA followed by Bonferroni post hoc test).
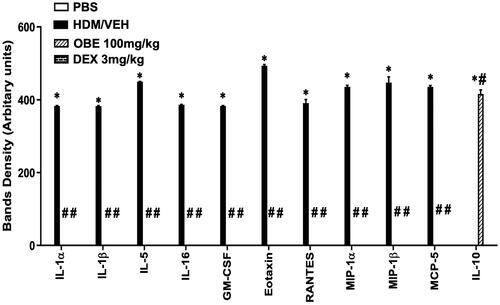
Figure 10. Effect of preventive treatment with OBE, at a single dose of 100 mg/kg; i.p., on the HDM-induced expression of phosphorylated (A) EGFR (B) ERK1/2 and (C) AKT. Lung sections were taken from the different treatment groups; PBS-challenged mice pre-treated with vehicle (PBS group), HDM-challenged mice pre-treated with vehicle (HDM group), HDM-challenged mice pre-treated with OBE (100 mg/kg; i.p) (OBE group) and HDM-challenged mice pre-treated with DEX (3 mg/kg; i.p.) (DEX group), thereafter these lung sections were immunostained for pEGFR, pERK1/2 and pAKT. The left-hand panel displays the expression of pEGFR, pERK1/2 and pAKT (red), whilst the right-hand panel displays the overlay with DAPI (blue); scale bar = 50 µm. Bar graphs presents the quantitative assessment of fluorescence intensity of pEGFR, pERK1/2 and pAKT (arbitrary units). Data are expressed as mean ± SEM (n = 4–5). *p < 0.05 vs. time-matched PBS-challenged mice, #p < 0.05 vs. HDM-challenged mice (Kruskal-Wallis test followed by Dunn’s multiple comparison test). Western blot analysis of (D) pERK1/2 and total ERK1/2 protein levels from lungs with different treatment groups. The blots are of two pooled lung sample (n = 6, total).