
Figures & data
Figure 1. Trial profile.
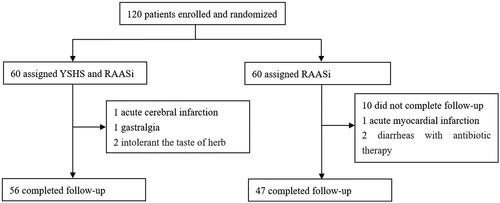
Table 1. Baseline characteristics and follow-up data of the cohort.
Table 2. Baseline characteristics and follow-up data of the cohort stratified by gender.
Figure 2. (A) The rarefaction analysis between the number of samples and the number of OTUs. (B–C) Phylogenetic diversity of the gut microbiome between patients in the control and YSHS group at baseline (C0, T0) and at 4-month follow-up (C1, T1) according to the Sobs and Shannon index. (D) Principal Coordinate Analysis (PCoA) of the gut microbiota of patients in the control group at baseline (C0) and at 4-month follow-up (C1). (E) Principal Coordinates Analysis (PCoA) of the gut microbiota of patients in the YSHS group at baseline (T0) and 4-month follow-up (T1).
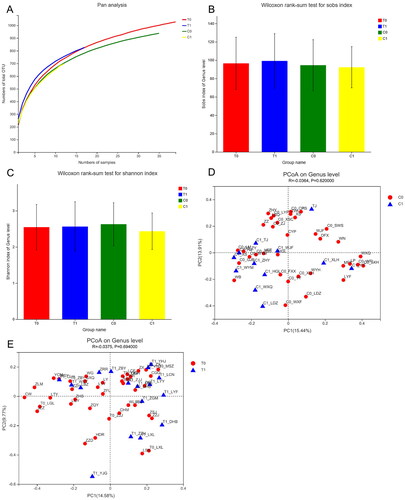
Figure 3. (A) Venn diagram showing the overlaps between the patients in the control group at baseline (C0) and 4-month follow-up (C1). (B) Venn diagram showing the overlaps between the patients in the YSHS group at baseline (T0) and at 4-month follow-up (T1). (C) Relative abundance of the gut microbiota in chronic kidney disease patients in the control and YSHS group at baseline (C0, T0) and 4-month follow-up (C1, T1) at the genus level. (D) Histogram of the LDA scores computed for differentially abundant bacterial taxa between baseline (T0) and 4-month follow-up (T1) in the YSHS group.
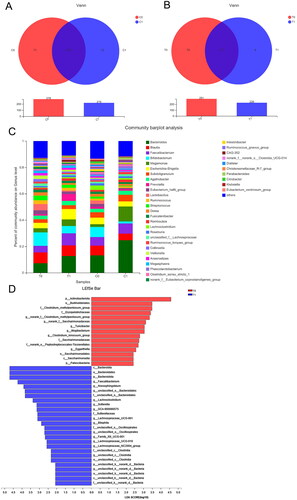
Figure 4. (A) Relative abundance of taxa between patients in the control group at baseline (C0) and at 4-month follow-up (C1). (B) Relative abundance of taxa between patients in the YSHS group at baseline (T0) and at 4-month follow-up (T1). (C) Heatmaps showing correlations between differentially abundant microbiota genera and clinical parameters in chronic kidney disease patients treated with YSHS.
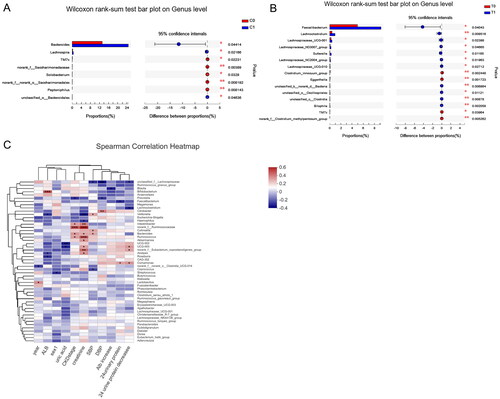
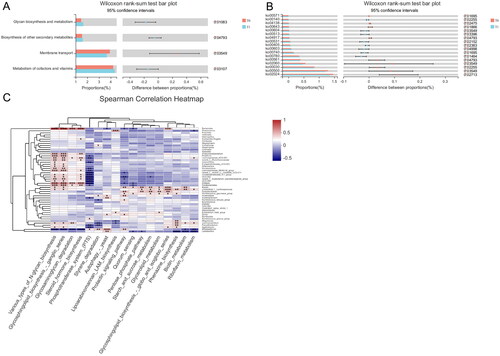
Figure 5. (A) KEGG pathway based on level 2 for the intervention group. (B) KEGG pathway based on level 3 for the intervention group. (C) Heatmaps showing correlations between microbiota genera and the KEGG pathway for the intervention group.
Supplemental Material
Download PDF (1 MB)Data availability statement
The data described in the manuscript will be made available upon reasonable request.