
Figures & data
Figure 1. A Flow diagram of evidence selection.
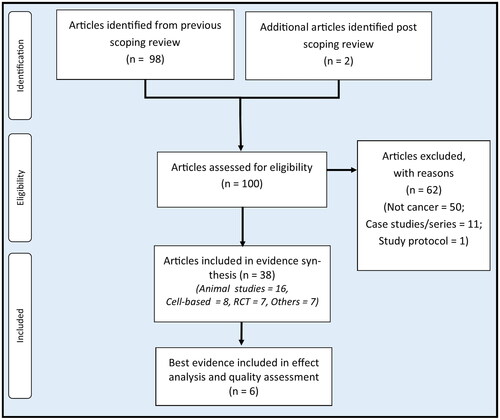
Table 1. Results from human and animal studies on the immune restorative capacity of RBAC in cancer.
Figure 2. The immune restorative effects of rice bran arabinoxylan compound (RBAC). (A) shows some immune functions that are affected by tumour growth resulting in the suppression of antitumor activity. (B) shows the biological response-modifying effects of RBAC restoring immune function in cancer patients.
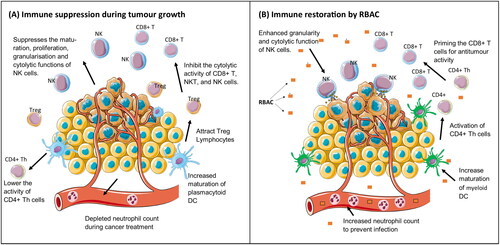
Table 2. The in vivo anticancer effects of RBAC from murine models with tumour growth inhibition and life prolongation as outcome measures.
Table 3. The direct anticancer effects of RBAC and the potential mechanisms.
Figure 3. The anticancer effect of RBAC is achieved through both the intrinsic pathway via the increased susceptibility of CD95 (Fas/APO-1) ligands in the cancerous cells to promote apoptosis and the extrinsic pathway through the downregulation of the antiapoptotic Bcl-2 proteins to lower membrane potentials, leading to the upregulation of the tumour-suppressing P53 gene and the upregulated production of the apoptotic Bax and caspase-3 signalling proteins. Malignant cell proliferation is arrested with evidence of increased hypodiploid cell counts in the SubG1 phase in cell cycle analysis. The antioxidant and cytokine-modulating capacities of RBAC also augment proapoptotic activity.
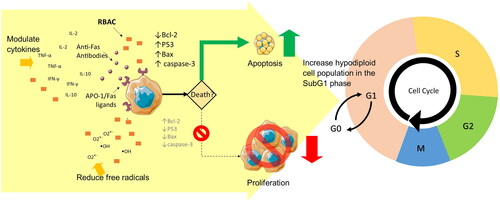
Table 4. In vivo studies investigating the chemoprevention activities of RBAC.
Table 5. Results from in vitro, in vivo, and human studies on the synergistic effects of RBAC with chemotherapeutic agents.
Table 6. Results from animal and human studies on the protective effects of RBAC against the toxicity of chemotherapeutic agents.
Table 7. Results from animal and human studies on RBAC’s synergy with and protection against the adverse effects of radiation treatment.
Table 8. Results from animal and human studies on the synergistic effects of RBAC with other natural products.
Figure 4. A summary of the potential benefits of RBAC in cancer treatment.
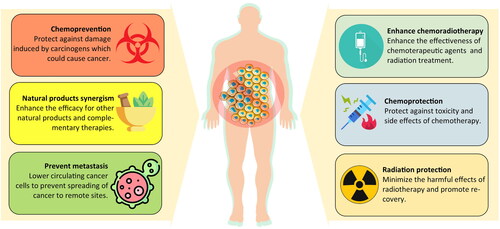
Table 9. A summary of all RBAC randomized controlled trials with survival and/or quality of life as outcome measures.
Figure 5. Forest Plot of survival events of RBAC-treated group compared to those of the control group.
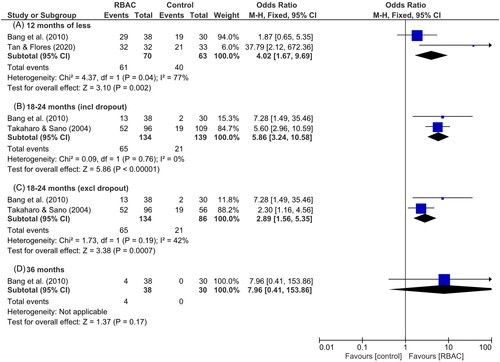
Figure 6. A Bubble chart visualizing the available evidence on the effect of RBAC on cancer patients’ quality of life (QoL). Each bubble represents an outcome assessed in one study, with the sample size defining the diameter of the bubble. Each study is assigned a different colour. X-axis: Statistical significance (p-value) of the outcome; Y-axis: QoL outcome measures.
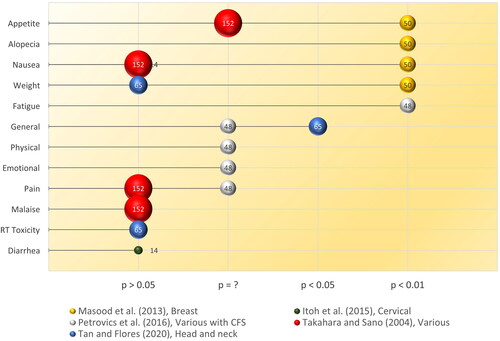
Figure 7. A summary of the quality assessment results by study.
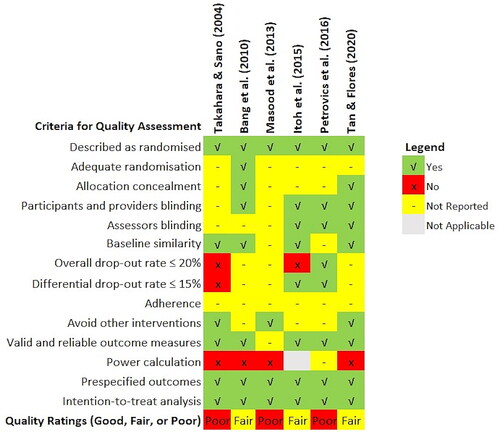
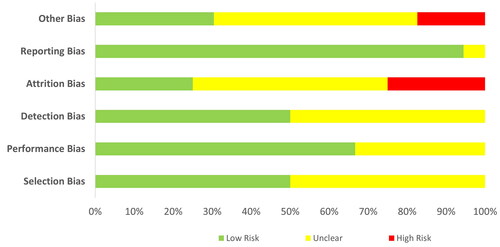
Figure 8. A Chart summarizing the quality assessment outcomes by types of bias.
Data availability statement
All data used in this study will be available via email to the corresponding author upon request.