
Figures & data
Table 1. Fatty acid composition of menhaden fish oil (sigma aldrich, USA).
Table 2. The blood glucose levels (mg/dL) of different groups of animals after 3 and 30 days.
Figure 1. The Y-maze performance of diabetic animals with LPS and fish oil supplementation; (A) the number of entries and (B) The time spent in the novel arm. The result is expressed as means ± SEM. *significant difference (p < 0.001) compared to the CTRL group, using one-way ANOVA followed by the tukey test.
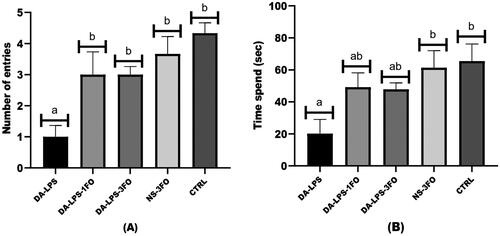
Table 3. The weight and relative weight of the cerebrum between different groups.
Figure 2. A-E Low magnification image of the cerebral cortex (10×, scale bar 200 µm), and F-J high magnification image of the cerebral cortex (40×, scale bar 20 µm) of HE staining from rat cerebrum. The DA-LPS group (F) shows scattered degenerating neurons with pyknotic nuclei, a large number of glial cells and dilated blood capillaries. The DA-LPS-1FO (G), and DA-LPS-3FO (H) showed fewer degenerating neurons with pyknotic nuclei (long arrow), a smaller number of glial cells, and slightly dilated blood capillaries. Meanwhile, the NS-3FO group (I) and CTRL group (J) showed no histopathological changes. ncb: neuron cell bodies; gcl: glial cell nuclei; bc: blood capilaries.
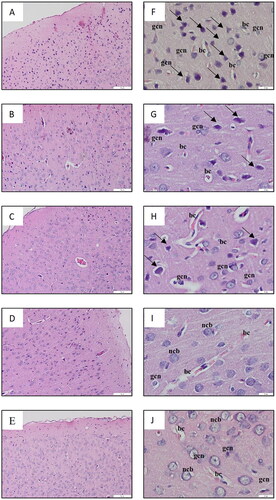
Figure 3. A-E Low magnification image of the hippocampus (4×, scale bar 200 µm) and F-J high magnification image of the hippocampus (20×, scale bar 50 µm) of HE staining from rat cerebrum. DA-LPS group (F) showed decreased of the PCL thickness (#). DA-LPS groups treated with 1 g/kg fish oil (G) and 3 g/kg fish oil (H) showed near normal thickness of the PCL with few degenerating neurons (black arrow). Meanwhile, the pyramidal neurons on the PCL formed a compact layer in the NA-3FO group (I) and the CTRL (J). ML: molecular layer, PCL: pyramidal cell layer, PL: Polymorphic layer, ncb: neuron cell bodies; gcl: glial cell nuclei; bc: blood capilaries.
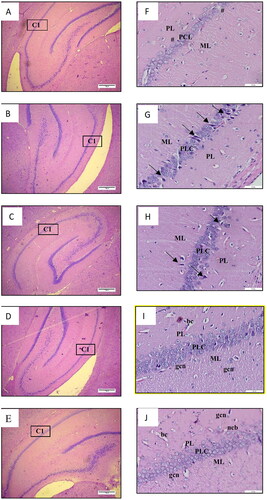
Table 4. The Inflammatory markers expression of TNF-α and IL-6 in different groups.