
Figures & data
Figure 1. Tabersonine increases CDDP sensitivity in TNBC cells. (A,B) CCK-8 assays were used to detect IC50 values in BT549 and MDA-MB-231 cells after incubation with CDDP for 48 h. (C,D) IC50 values of tabersonine in BT549 and MDA-MB-231 cells, after treatment for 48 h. (E,F) BT549 and MDA-MB-231 cells were treated with 10 μM CDDP, 10 μM tabersonine or (10 μM CDDP + 10 μM tabersonine), followed by the measurement of cell viability using CCK-8 assays. (G,H) The colony formation potential was determined in BT549 and MDA-MB-231 cells after treatment with 10 μM CDDP, 10 μM tabersonine or (10 μM CDDP + 10 μM tabersonine). **p < 0.01. Tab: tabersonine; CDDP: cisplatin.
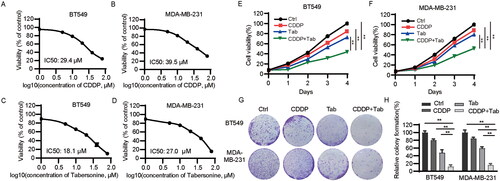
Figure 2. Quantitative proteomic analysis demonstrates differentially expressed proteins (DEPs) and enrichment analysis in tabersonine-treated TNBC cells. (A,B) The volcano plots illustrated DEPs between tabersonine-untreated and treated (10 μM) TNBC cells (BT549 and MDA-MB-231). (C,D) GO and KEGG enrichment analysis of 10 main pathways in BT549 and MDA-MB-231 cells.
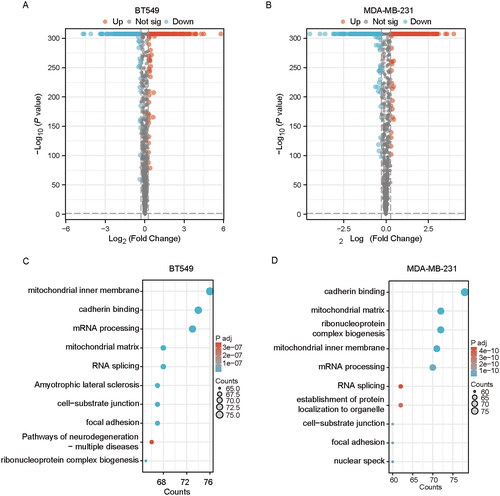
Figure 3. Tabersonine increases CDDP sensitivity by inhibiting EMT in TNBC cells. (A,B) The Transwell assay demonstrates cell invasive ability in BT549 and MDA-MB-231 cells after treatment of 10 μM CDDP, 10 μM tabersonine or (10 μM CDDP + 10 μM tabersonine). (C–E) Wound healing assays of BT549 and MDA-MB-231 cells that were treated with 10 μM CDDP, 10 μM tabersonine or (10 μM CDDP + 10 μM tabersonine). (F) Western blot examined the expression of EMT-related proteins, including E-cadherin, N-cadherin and Vimentin, in BT549 and MDA-MB-231, after treatment of 10 μM CDDP, 10 μM tabersonine or (10 μM CDDP + 10 μM tabersonine). **p < 0.01. Tab: tabersonine; CDDP: cisplatin.
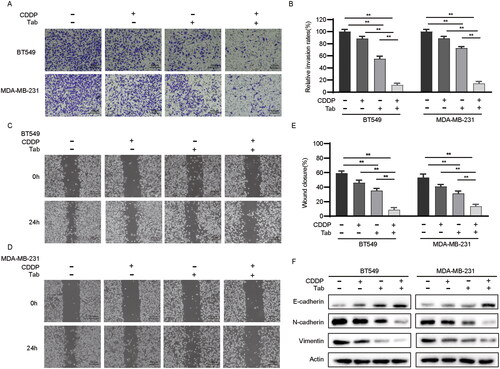
Figure 4. AURKA is a potential target of tabersonine in TNBC. (A,B) Venn diagram to exhibit the intersection between predicted targets (from PharmMapper Server) and DEPs (from quantitative proteomic analysis). (C) The heatmap showing the expression of five overlapping proteins in BT549 and MDA-MB-231 cells. (D–E) Comparison of AURKA transcriptional expression between BC and control tissues (D), as well as in different subtypes of BC (E). (F–I) Scatter plots of the association between AURKA expression and platinum IC50 values in the BC (GSE21653, GSE22219 and TCGA_BRCA) and TNBC (GSE97342) datasets. (J-K) Kaplan–Meier plotter revealed the association of AURKA expression with DMFS and RFS in TNBC patients receiving chemotherapy. (L) PPI network of AURKA and EMT-related genes, performed by the STRING database. **p < 0.01.
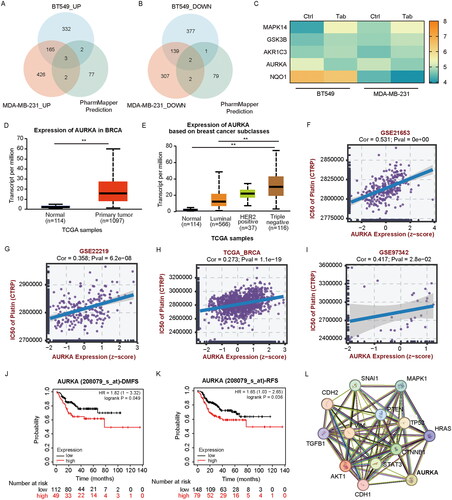
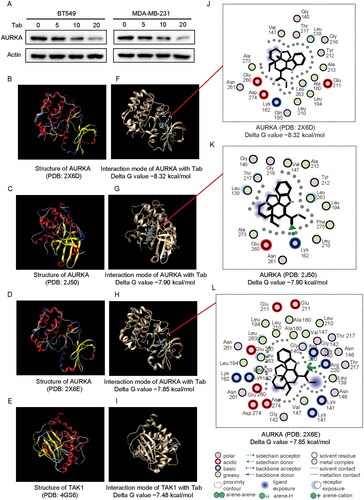
Figure 5. Combined experimental analysis and molecular docking assays identify the relationship between tabersonine and AURKA. (A) Expression of AURKA in BT549 and MDA-MB-231 cells incubated with a specified concentration of tabersonine (0, 5, 10 and 20 μM). (B–E) the 3D structure of AURKA (PDB: 2X6D; PDB: 2J50; PDB: 2X6E) and TAK1 (positive control, PDB: 4GS6), downloaded from the PDB database. (F–I) Predictions of tabersonine binding to AURKA or TAK1. (J–L) The interaction map (2D) between tabersonine and AURKA (PDB: 2X6D; PDB: 2J50; PDB: 2X6E).
Data availability statement
The data sets used and/or analysed during this study are available from the corresponding author on reasonable request.