
Figures & data
Table 1. Primer sequences for quantitative PCR.
Figure 1. Different doses of GGD attenuate PE-induced cardiac hypertrophy in mice. (A) Representative myocardium pictures. (a) Gross images show the size of whole organs; (b) H&E staining heart sections from paraffin embedding samples demonstrate the thickening of ventricular walls; (c) Zooming-in H&E staining heart sections demonstrate details of tissue samples, mononuclear cell infiltration at the site indicated by the black arrow, and fibroplasia was indicated by blue arrows. (B) Quantification of HW/BW, HW/TL, LW/BW and LW/TL in mice. (C) Representative m-mode echocardiography images. (D) Quantification of echocardiography parameters. *p < 0.05 vs. Con; #p < 0.05 vs. PE; GGD: Guizhi-Gancao Decoction; PE: phenylephrine; HW/BW: heart weight body to weight ratio; HW/TL: heart weight to tibia length ratio; LW/BW: lung weight to body weight ratio; LW/TL: lung weight to tibia length ratio; EF: ejection fraction; FS: fractional shortening; IVSd: interventricular septum thickness at end-diastole; IVSs: interventricular septum thickness at end-systole.
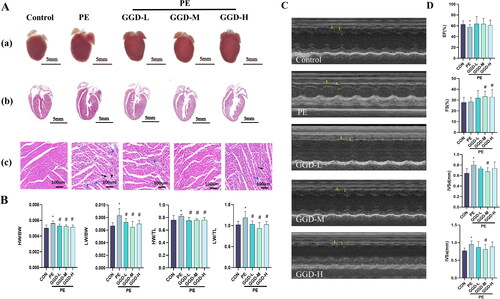
Table 2. Essential information about GGD active components.
Figure 2. Overlapping target genes between GGD and HF and the drug-compound-target-disease network. (A) The Venn diagram shows 141 drug-disease common targets between GGD and HF. (B) The network consists of 90 active ingredients in GGD (blue triangles), 141 drug-disease common targets (green circles) and HF (red diamond). The thickness of lines represents the binding intensities between compounds and targets. GGD: Guizhi-Gancao Decoction; HF: heart failure.
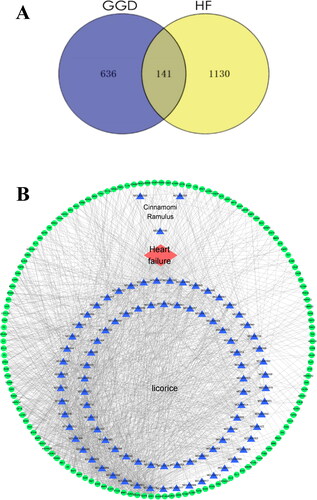
Table 3. Topological analysis of the top 20 common targets with the highest degree values.
Figure 3. Protein–protein interaction network of overlapping targets between GGD and HF. (A) Each edge represents the interaction between the proteins, and the more lines the greater the degree of association. (B) Cross-target gene network map between 90 active ingredients and HF-related targets. Each circle represents the interaction between the proteins. The change in color depth represents the size of the degree value, the darker the color, the stronger the degree between the associations.
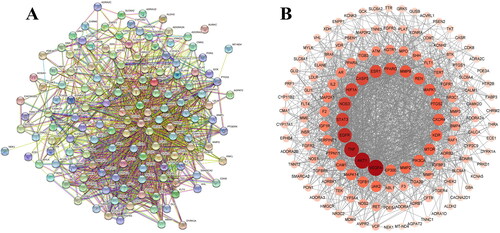
Figure 4. Clusters of common targets of the GGD against HF. (A–G) identified gene clusters 1 through 7 by molecular complex assay (MCODE).
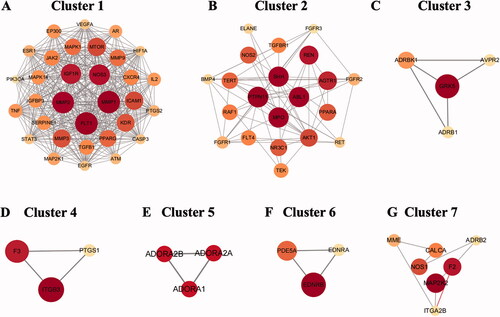
Figure 5. GO and KEGG pathway enrichment analysis. (A) GO enrichment analysis. (B) KEGG enrichment pathway annotation. GO: gene ontology; KEGG: Kyoto Encyclopedia of Genes and Genomes.
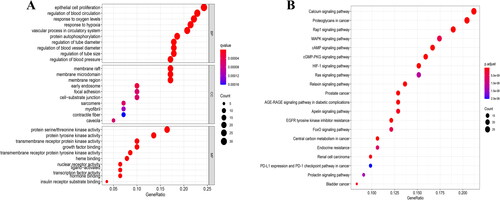
Table 4. The top 20 KEGG pathway terms for GGD anti-HF.
Figure 6. Molecular docking of compounds from GGD with A2aAR and A1AR. (A) A2aAR-inermine. (B) A2aAR-jaranol. (C) A2aAR-peroxyergosterol. (D) A1AR-DFV. (E) A1AR-jaranol. (F) A1AR-peroxyergosterol.
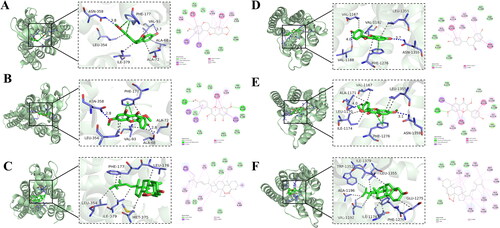
Figure 7. HPLC chromatograms of reference standards and GGD sample. (A) Reference chromatogram: (a) cinnamic acid; (b) cinnamaldehyde. (B) Sample chromatogram: (a) cinnamic acid; (b) cinnamaldehyde. (C) Reference chromatogram: (a) isorhamnetin; (b) schisandrin (is); (c) β-sitosterol. (D) Sample chromatogram: (a) isorhamnetin; (b) schisandrin (is); c. β-sitosterol. (E) Reference chromatogram: (a) DFV; (b) glycyrrhizic acid. (F) Sample chromatogram: (a) DFV; (b) glycyrrhizic acid.
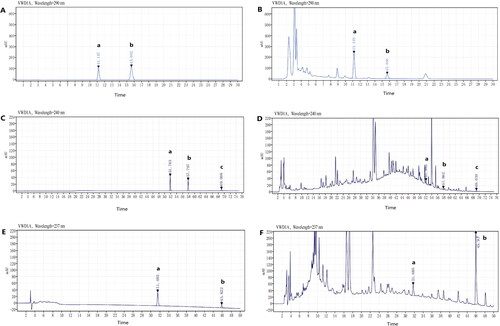
Figure 8. GGD attenuates PE-induced cardiomyocyte hypertrophy in vitro. (A) Dose-response curve and EC50 of GGD on cardiomyocyte surface area. (B) Representative immunofluorescence images of α-actinin (red) and DAPI (blue) in cardiomyocytes (scale bar = 50 μm). (C) The mRNA expression of ANP, BNP and MYH7/MYH6. (D) Representative immunofluorescence images of A1AR (green), CTNT (red) and DAPI (blue) in cardiomyocytes (scale bar = 50 μm). (E) Representative immunofluorescence images of A2aAR (green), CTNT (red) and DAPI (blue) in cardiomyocytes (scale bar = 50 μm). (F) Quantification of fluorescence intensity of A1AR and A2aAR. (G) Quantification of A1AR and A2aAR mRNA expression. (H, I) Representative blots and quantification of A1AR and A2aAR. *p < 0.05 vs. Con; #p < 0.05 vs. PE.
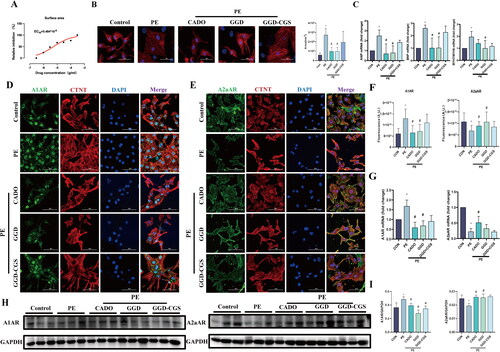
Figure 9. CGS15943 Antagonized the protective effects of GGD on PE-induced cardiac hypertrophy. (A) Representative myocardium pictures. (a) Gross images show the size of whole organs; (b) H&E staining heart sections demonstrate the thickening of ventricular walls; (c) Zooming-in H&E staining heart sections demonstrate details of tissue samples, mononuclear cell infiltration at the site indicated by the arrow; (d) Zooming-in Masson staining heart sections demonstrate collagen fibers, the arrow indicates the site of collagen deposition; (e) Zooming-in Masson’s trichrome stained section of heart surrounding blood vessels shows perivascular fibrosis, the arrow indicates the site of collagen deposition. (B) Quantification of HW/BW, HW/TL, LW/BW and LW/TL in mice. (C) Representative m-mode echocardiography images. (D) Quantification of echocardiography parameters. (E) Quantification of ANP, BNP and MYH7/MYH6 mRNA expression. *p < 0.05 vs. Con; #p < 0.05 vs. PE; GGD: Guizhi-Gancao Decoction; PE: phenylephrine; HW/BW: heart weight body to weight ratio; HW/TL: heart weight to Tibia length ratio; LW/BW: lung weight to body weight ratio; LW/TL: lung weight to Tibia length ratio; EF: ejection fraction; FS: fractional shortening; IVSd: interventricular septum thickness at end-diastole; IVSs: interventricular septum thickness at end-systole.
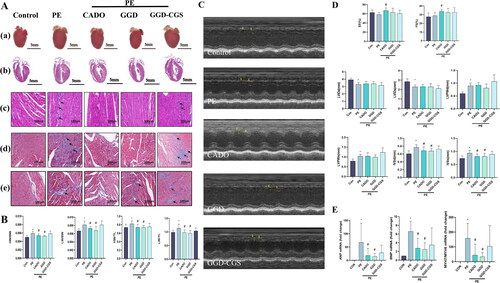
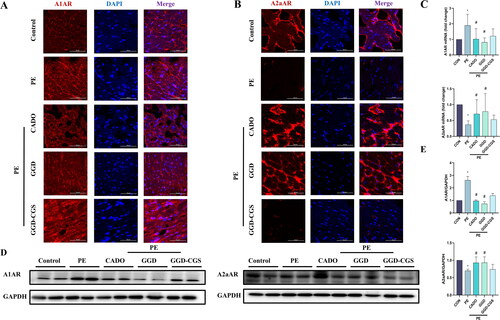
Figure 10. GGD blocked PE-induced expression changes of adenosine receptors. (A) Representative immunofluorescence images show A1AR (red) and DAPI (blue) (scale bar = 50 μm). (B) Representative immunofluorescence images show A2aAR (red) and DAPI (blue) (scale bar = 50 μm). (C) Quantification of A1AR and A2aAR mRNA expression. (D,E) Representative blots and quantification of A1AR and A2aAR protein expression. *p < 0.05 vs. Con; #p < 0.05 vs. PE.
Availability of data and materials
The datasets used and/or analysed during this study are available from the corresponding author on reasonable request.