
Figures & data
Table 1. Annotation of peaks detectable in SPI and SPM in the HESI negative ion mode, numbered on basis of retention time.
Figure 1. Effects of SPM and SPI on proinflammatory functions in human neutrophils stimulated with LPS. (A) Effect on IL-8 production (% of stimulated control sample) (B) Effect on TNF-α production (% of stimulated control cells). NST: non-stimulated control cells; ST: stimulated control cells. Statistical comparison between treatments was performed by ANOVA with Dunnett’s multiple comparison post hoc test. #, p < 0.001 versus non stimulated control; ***, p < 0.001 versus stimulated control.
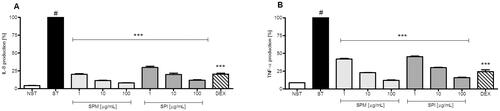
Table 2. 13C (175 MHz) and 1H (700 MHz) NMR resonance values of compound 41 in methanol-d4 and comparison with carbon data of icariside B6 recorded in pyridine-d5 (Miyase et al. Citation1988).
Figure 2. (A) Effect of SPM and SPI on NO production in RAW 254.7 macrophages stimulated with LPS/IFN-γ. ST: stimulated cells, NST: non-stimulated control cells; L-NMMA: positive control; ** p < 0.01. (B) effect of SPM and SPI on the viability of HNO97 human tongue carcinoma cells; 0.1% DMSO: control cells treated with solvent; VBN: positive control; * p < 0.05. Statistical comparison to ST (A) and to 0.1% DMSO (B) was performed by Kruskal–Wallis One way analysis of variance on ranks with Dunn’s multiple comparisons versus control group post hoc test.
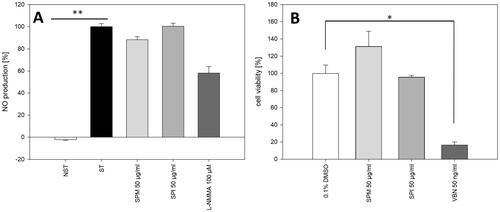
Figure 3. UHPLC-HRMS analysis of SPI and SPM. HESI negative mode base peak chromatograms (m/z 110-1650) of SPI (A) and SPM (B). Peak numbers are as indicated in .
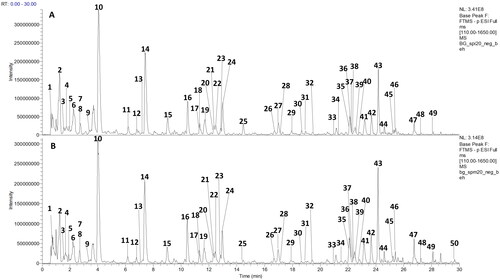
Figure 4. Structures of compounds isolated and structurally identified from S. persica methanolic leaf extract (compound numbers are as in ).
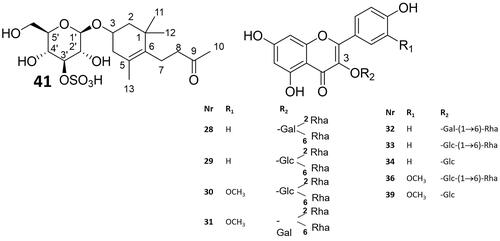
Figure 5. A, B: Effects of different concentrations of GT (10) and BIT on proinflammatory functions in human neutrophils stimulated with LPS. (A) Effect on IL-8 production. (B) Effect on TNF-α production. Statistical test was same as indicated in . #, p < 0.001 vs. unstimulated control; ***, p < 0.001 vs. stimulated control; (C) Effect of different concentrations of BIT on cell viability of HNO97 tongue carcinoma cells. Dashed lines: 95% confidence band; dotted lines: 95% prediction band.
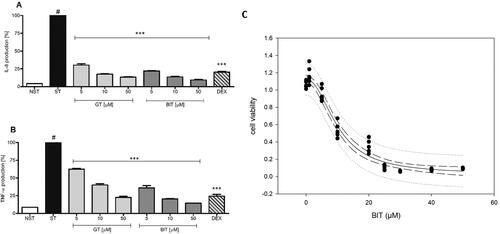
Table 3. Effects of pure compounds present in SPI and SPM on human neutrophils stimulated with LPS, on murine RAW 264.7 macrophages stimulated with LPS/IFNγ and on the viability of HNO97 cells.