Figures & data
Figure 1. Analysis of the mechanism of HUANGQI in treating Alzheimer’s disease.
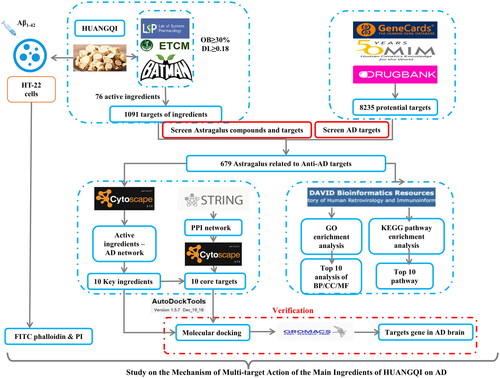
Figure 2. Venn diagram. (a) Compounds from 3 databases. (b) Shared targets of HUANGQI and Alzheimer’s disease.
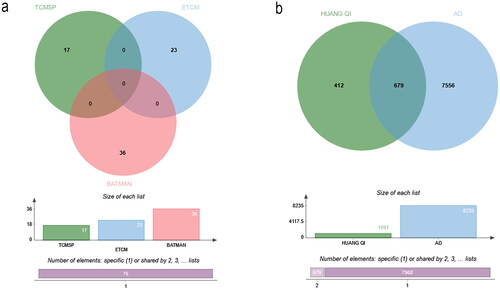
Table 1. The List of 76 active compounds.
Figure 3. PPI network construction (a) PPI network of common protein targets of HUANGQI. (b) Cluster 1 and its core targets. (c) cluster 2 and its core targets. (d) cluster 3 and its core targets. (e) bar graph of the key protein targets.
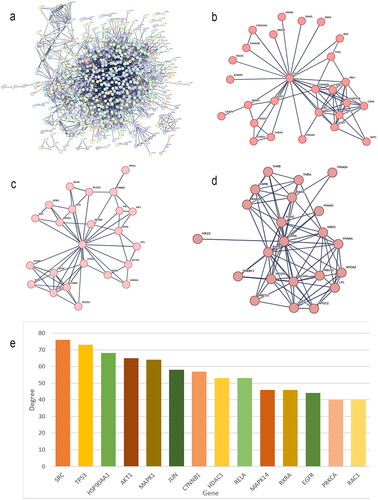
Figure 4. (a) Network diagram of HUANGQI-component-target-AD. (b) Degree values of the main active ingredients in HUANGQI. (c) Degree values of the core intersection targets.
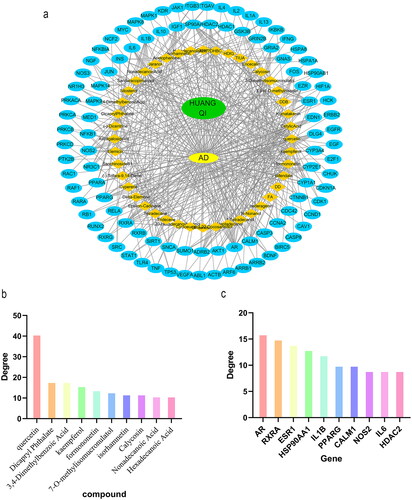
Table 2. Information on the main active ingredients of HUANGQI.
Table 3. Topological parameters of the core targets of HUANGQI for AD treatment.
Figure 5. GO enrichment analysis (top 10). (a) Bar graph of the GO analysis results. (b) Chord diagram of cellular component terms. (c) Chord diagram of biological process terms. (d) Chord diagram of the molecular function terms.
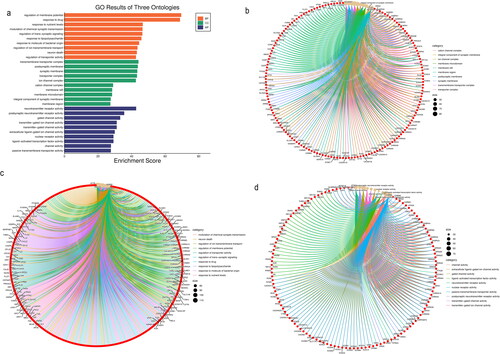
Figure 6. KEGG pathway enrichment analysis (top 10). (a) Bar graph of the KEGG pathway analysis results. (b) Bubble plot of the KEGG pathway analysis results.
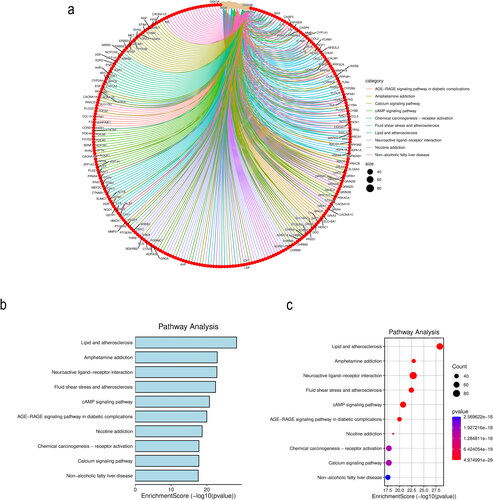
Figure 7. Heatmap of the binding energies of the core active ingredient and the core target docking site.
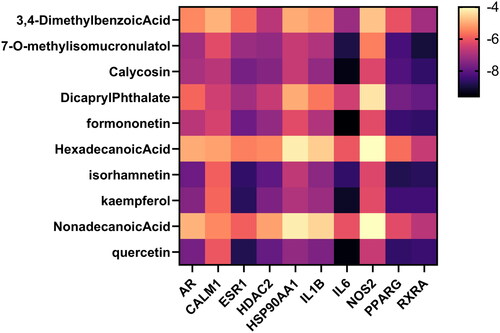
Figure 8. Molecular docking data of the core active components and targets of HUANGQI. (a) HDAC2 docking with kaempferol, quercetin and its original ligand. (b) IL6 docking with kaempferol, quercetin and its original ligand.
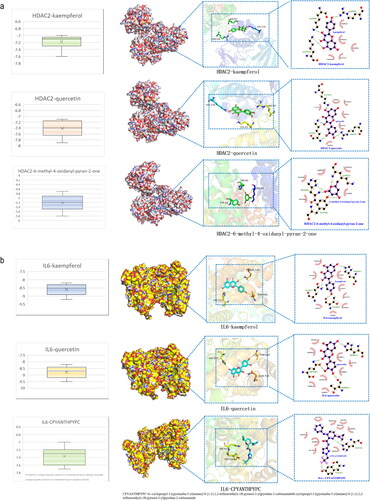
Figure 9. Molecular simulation of the core active components and targets of HUANGQI. (a) The RMSD of HDAC2 and IL6 for different core active components and their original ligands. (b) RMSF of HDAC2 and IL6 for different core active components and their original ligands. c the binding free energies of HDAC2 and IL6 to different core active components and their original ligands. Blue is the binding energy obtained from molecular docking; orange is the binding free energy calculated by molecular dynamics simulation and the MM-PBSA method.
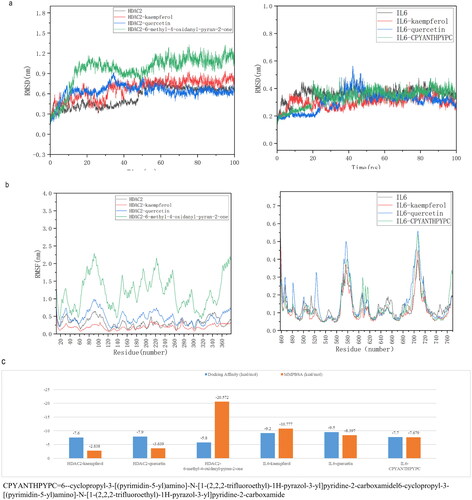
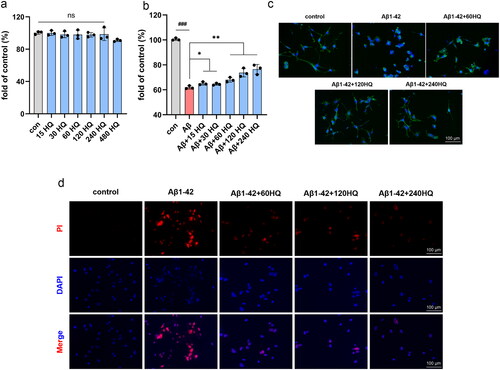
Figure 10. HUANGQI ameliorates Aβ1-42-induced neuronal cell cytotoxicity (a, b) A CCK-8 assay was used to test the viability of HT-22 cells. (c) FITC-phalloidin assay showing the cytoskeleton of HT-22 cells in different groups. (d) PI indicates the number of dead HT-22 cells. The results are shown as the mean ± SD. ###p < 0.001, **p < 0.01, *p < 0.05 compared with the control group (n = 3).