
Figures & data
Figure 1. Research process conceptualization
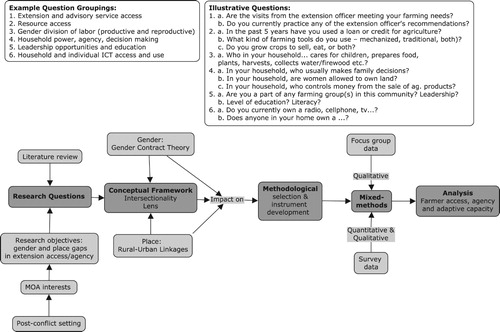
Figure 2. Liberia study area including three counties and 22 surveyed communities.
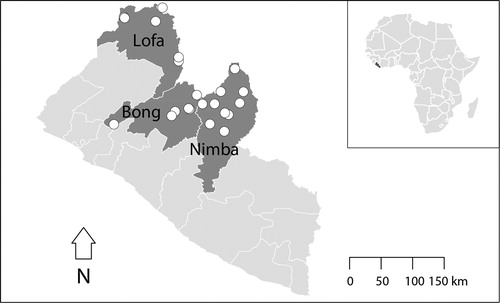
Table 1. Participant Demographic Characteristics
Table 2. Participant level of education, relationship status, and age by gender
Figure 3. Access to ICT devices. Note: Values represent the percent of total devices owned by 352 participants; multiple devices could be selected.
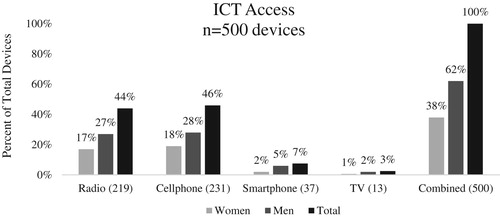
Figure 4. Satisfaction with the ‘amount of use’ for farmer owned ICT devices. Note: Values represent the percent difference between a respondent’s reported satisfaction to their access reported in .
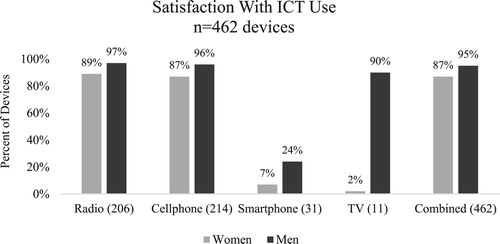
Figure 5. Percent of all respondents by county (n = 352) with access to Ministry extension services via a DAO in the past three years. Note: Total is the sum of women and men for each county and overall
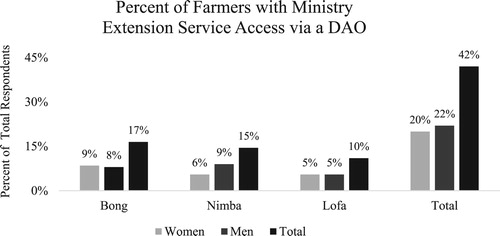
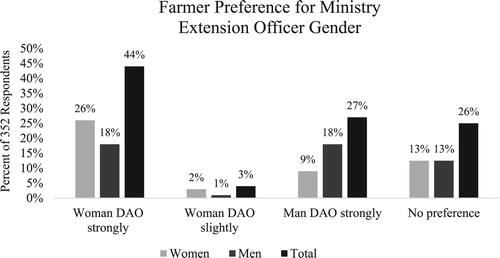
Figure 6. Respondent gender preference for Liberian extension officers. Note: Total is the sum of women and men for each response, n = 352
Survey_Instrument.pdf
Download PDF (287.5 KB)supplemental_qualquotes.pdf
Download PDF (413.8 KB)Data availability statement
The data that support the findings of this study are available on request from the corresponding author. The data are not publicly available due to their containing information that could compromise the privacy of research participants.