
Figures & data
Figure 1. Barbell-type tongue piercing close to the tongue tip.
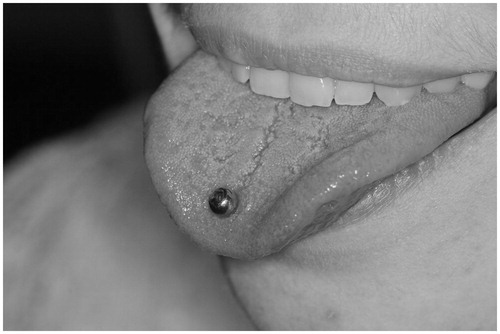
Table 1. Test word sequences for speech quality ratings categorized for their places of articulation and consonants tested.
Table 2. Influence of the speaker group, i.e. pierced subjects versus non-pierced subjects versus subjects that removed their piercing on the speech quality ratings for the different sample types based on a repeated measures one-factorial ANOVA.
Figure 2. Speech quality ratings for the sentence from the reading text separately for each speech quality dimension, speaker group (non-pierced speakers versus pierced speakers with removed piercings versus pierced speakers with piercings in place), and rater group (naïve male raters versus naïve female raters versus SLPs). The black lines indicate ±1 SD ranges.
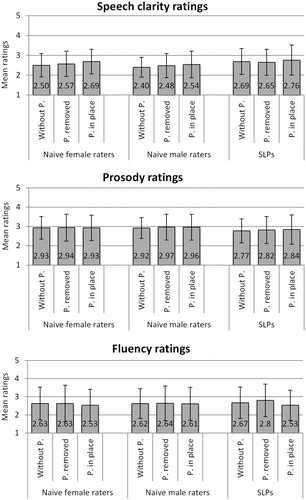
Figure 3. Differences in speech clarity ratings for the word sequences with the different target consonants and consonant combinations between the groups of non-pierced subjects and subjects with piercing in place. The black lines indicate +1 SD ranges.
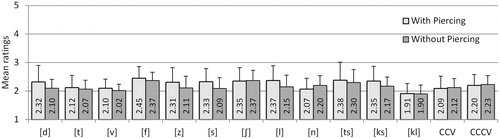
Figure 4. Speech quality ratings of the SLPs for the spontaneous speech samples, separated by speaker group and speech quality characteristic. The black lines indicate ±1 SD ranges.
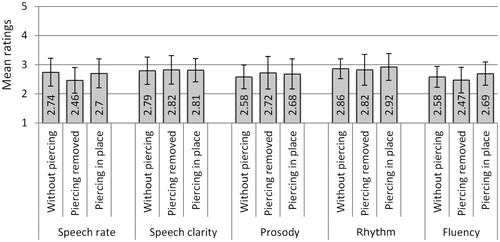
Figure 5. Influence of the speakers’ sex on the speech quality ratings for the different sample types. The black lines indicate the ranges of ±1 standard error.
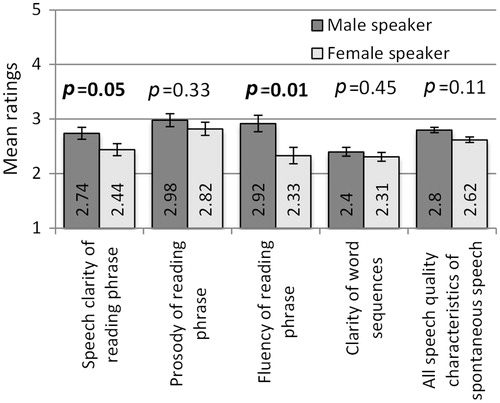
Figure 6. Influence of the rater group on the speech quality ratings for the different sample types. The black lines indicate the ranges of ±1 standard error.
