
Figures & data
Table 1. Results from individual with PD’s ratings with QASD pre-treatment, post-treatment and at follow-up (FU) 6 and 12 months post-treatment. Total and separate subscale scores are shown. A higher score indicates more severe symptoms.
Table 2. Duration of the different registration periods pre-treatment, during treatment (Treat 1–4), post-treatment and at follow-up (FU) 3, 6 and 12 months post-treatment.
Figure 1. Mean voice sound level (Lvoice) and mean environmental noise sound level (Lnoise) during the whole week-long monitoring periods for both participants (vertical mouth-to-microphone distance of approximately 10 cm).
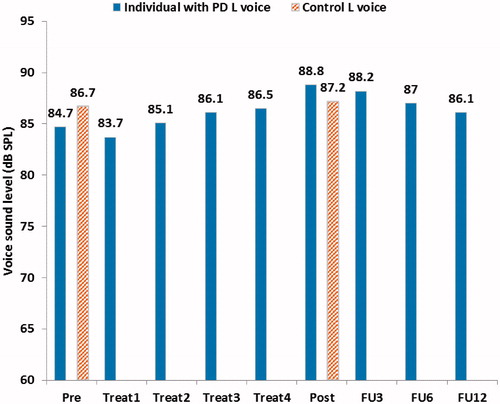
Figure 2. Mean voice sound level (Lvoice) and mean environmental noise sound level (Lnoise) during the different monitoring periods with data presented for leisure and work activities respectively for both participants (vertical mouth-to-microphone distance of approximately 10 cm).
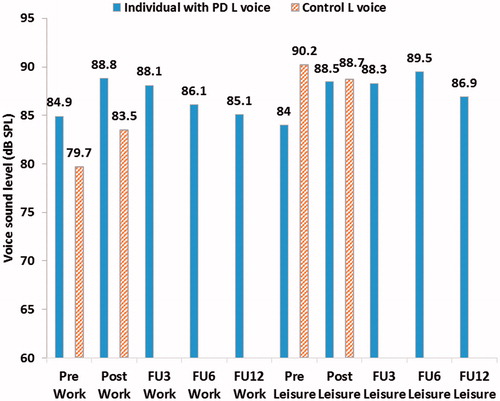
Figure 3. Mean voice sound levels (Lvoice) from laboratory recordings and for different ranges of environmental noise outside the clinic for both the individual with PD and the control (vertical mouth-to-microphone distance of approximately 10 cm).
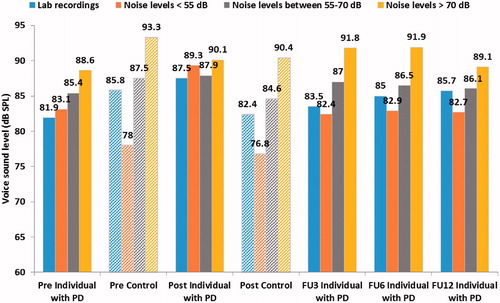
Table 3. Correlations between the participants’ Lvoice and the Lnoise within respective registration period including pre-treatment, post-treatment and at follow-up (FU) 3, 6 and 12 months post-treatment.