Figures & data
Figure 1. Average passage comprehension performance in four different listening conditions. A higher score indicates better performance. The maximum score is five. Error bars denote standard deviations (N = 23).
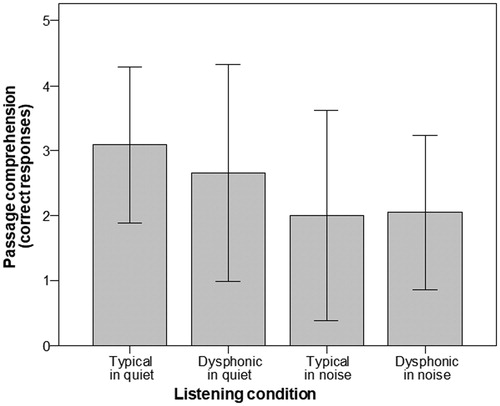
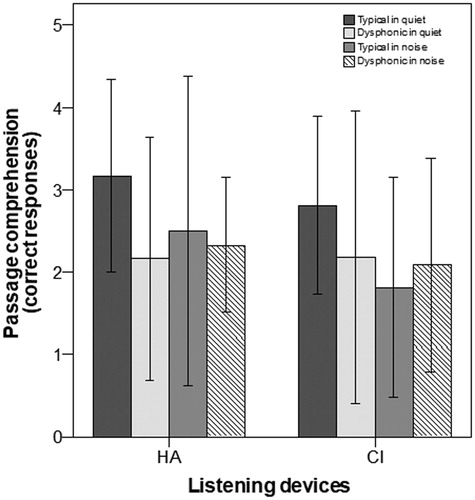
Figure 2. Average passage comprehension performance in four different listening conditions for children using bilateral CI (n = 11) and HA (n = 6). A higher score indicates better performance. The maximum score is five. Error bars denote standard deviations.