
Figures & data
Figure 1. Flow diagram based on the CONSORT 2010 Flow Diagram.
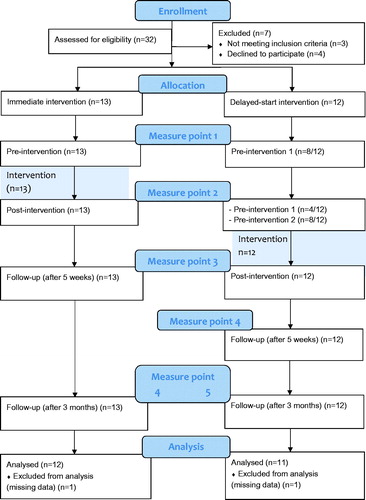
Table 1. Distribution of the 25 participating teachers’ years of teaching, number of certified teachers (teachers that completed their education) and age.
Table 2. Overview of questionnaires with respective range and values from validation studies of which some are based on clinical populations.
Table 3. Values from 0 weeks pre-training for all measures presented with mean, standard deviation, and number of responding participants.
Figure 2. Aggregated data from all teachers participating in the study. Points correspond to mean values and confidence intervals are the same as in , for the respective scales (see titles of sub-panels). The dotted line through the first measure point (Pre-training) indicates the baseline so that changes at the other points are more clearly visible. Note that confidence intervals overlap the baseline for some effects that are nevertheless significant (cf. ). This is due to small differences between predicted values and calculated means, as the model included covariates.
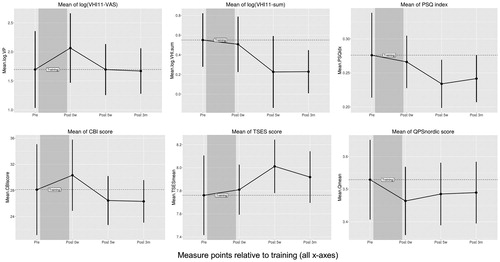
Table 4. Regression (LME) coefficients and confidence intervals for the analysis including all participants, all scales (subpanels a–f) and all measurements (except the delayed training-group’s five weeks pre-test) relative to training.