
Figures & data
Figure 1. Flow chart of trial process with placement for vocal effort ratings (VER 1-4), vocal warm-up interventions (loud reading or SOVTE) and silence periods. The procedure was prefaced with a practice session and baseline recordings of vocal effort levels.
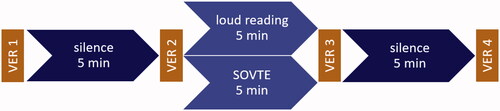
Figure 2. (Left) self-evaluation of vocal effort as designed by van Leer and van Mersbergen, first published in Journal of Voice, 2017 [Citation16]. (Right) self-evaluation of vocal effort as presented in the experimental set-up.
![Figure 2. (Left) self-evaluation of vocal effort as designed by van Leer and van Mersbergen, first published in Journal of Voice, 2017 [Citation16]. (Right) self-evaluation of vocal effort as presented in the experimental set-up.](/cms/asset/21ebdb65-f9d8-4c5d-96dc-7bc37d0febb4/ilog_a_2075459_f0002_c.jpg)
Figure 3. (Left) visual representation as shown prompt for ascending pitch glides (descending not shown). (Right) visual representation as shown prompt for ascending hills/accents for recorded pitch range during SOVTE (own material).
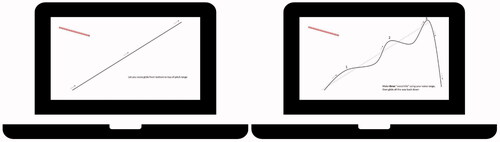
Figure 4. Absolute (left) and relative (right) changes in self-evaluated vocal effort. Bars represent standard error.
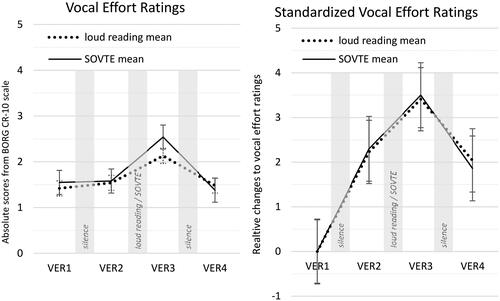
Table 1. Individual vocal effort ratings (VER) at each given time point: VER 1–4 and within-subject standard deviation (WSSD).
Table 2. Aggregated group results, explaining mean and standard deviation (SD) of vocal effort ratings (VER) at four time points: VER 1–4 with time points compared within groups in total with Friedman’s test for repeated measures as well as at each time change with Wilcoxon’s signed rank test.
Table 3. Aggregated group results, explaining changes to self-evaluated scores of vocal effort with within-subject standard deviation (WSSD, see ) taken into account at four time points: VER 1–4.