
Figures & data
Table 1. Individual data on all 17 participants at different timepoints.
Figure 1. Percent consonants correct (PCC) at the three-time points (T1–T3). The solid black line represents norm values for 3-, 5- and 7-year-old Swedish children without cleft lip and palate [Citation15].
![Figure 1. Percent consonants correct (PCC) at the three-time points (T1–T3). The solid black line represents norm values for 3-, 5- and 7-year-old Swedish children without cleft lip and palate [Citation15].](/cms/asset/d81fce65-7c82-4ad9-8eea-d8f1f0270928/ilog_a_2083673_f0001_b.jpg)
Figure 2. Development of the median PCC score for each participant between T1 and T3. The red dotted line represents the age-specific norms for 3-, 5- and 7-year-old children [Citation15].
![Figure 2. Development of the median PCC score for each participant between T1 and T3. The red dotted line represents the age-specific norms for 3-, 5- and 7-year-old children [Citation15].](/cms/asset/471d9225-cb15-4d18-bb3b-290159a131d9/ilog_a_2083673_f0002_c.jpg)
Figure 3. Mean consonant inventory at the three timepoints (T1–T3).
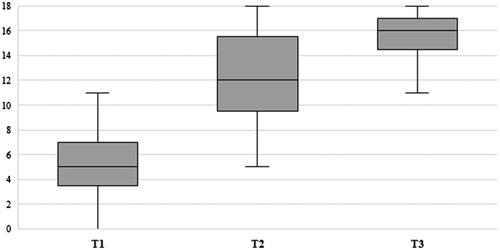
Figure 4. Percentage of children having established each consonant phoneme at T1, T2 and T3 (since the/ɧ/phoneme was not elicited for six and five children at T1 and T2, respectively, it is not included).
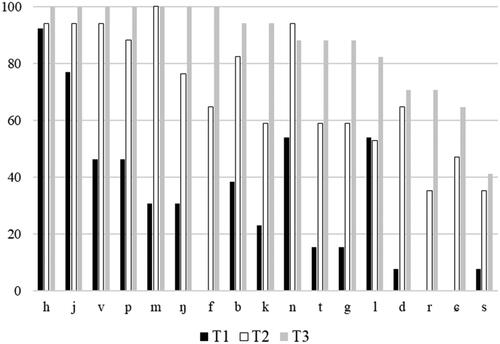
Table 2. Frequency of consonant errors (percentage of instances across the material) at different timepoints, presented as median (minimum-maximum) values.
Table 3. Number and percentage of children with different velopharyngeal-competence rates at each timepoint.