Figures & data
Table 1. Demographic information, participants.
Table 2. Participant distribution and interview setting.
Figure 1. Example from the analytic process of the content analysis.
Example of the analytic process in six steps from quote to overarching theme. 1. Quote: ‘Well, I think it has helped me in my parental role, and in trying to introduce a language with Melker, even though he doesn’t talk much yet. Umm, but he kisses a lot, and that’s fun. But it’s like, the main thing that it has given us is that it has given us, like, tools or things to do together with him.’ 2. Condensation: Helped me in my parental role, to stimulate language before he talks, as he communicates with gestures. It has given us tools and things to do together. 3. Code: Tools that supported the parent in the parental role. 4. Subcategory: Gained useful tools and strategies. 5. Category: Benefits the interaction within the family. 6. Overarching theme: Parents changed their mindset and practices through gained knowledge and personal contact.
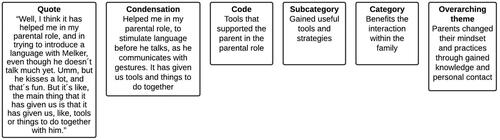
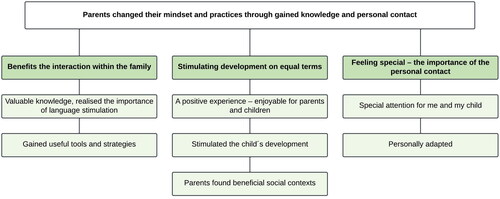
Figure 2. Overview of findings, the overarching theme, categories (n = 3) and subcategories (n = 7) of the result.
Text box chart visualizing the overarching theme and three main categories divided into seven subcategories. Overarching theme: parents changed their mindset and practices through gained knowledge and personal contact. Category 1: Benefits the interaction within the family, with the subcategories: (1) Valuable knowledge, realised the importance of language stimulation and (2) Gained useful tools and strategies. Category 2: Stimulating development on equal terms, with the subcategories (1) A positive experience – enjoyable for parents and children, (2) Stimulated the child’s development, and (3) Parents found beneficial social contexts. Category 3: Feeling special – the importance of the personal contact, with the subcategories (1) Special attention for me and my child, and (2) Personally adapted.