242
Views
7
CrossRef citations to date
0
Altmetric
ORIGINAL ARTICLE

Impact of hypertension on left ventricular hypertrophy regression and exercise capacity in patients operated for aortic valve stenosis

, &
Pages 167-174 | Received 19 Oct 2005, Published online: 12 Jul 2009

Figures & data

Table I.  Baseline characteristics of the study population.

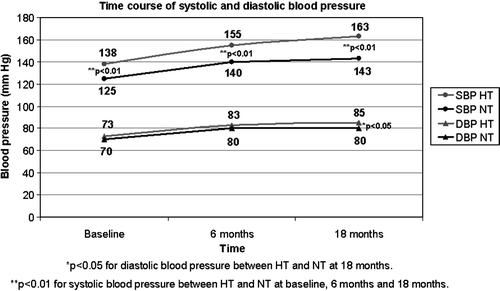
Figure 1.  Change in systolic and diastolic blood pressure during follow-up.

Figure 1.  Change in systolic and diastolic blood pressure during follow-up.

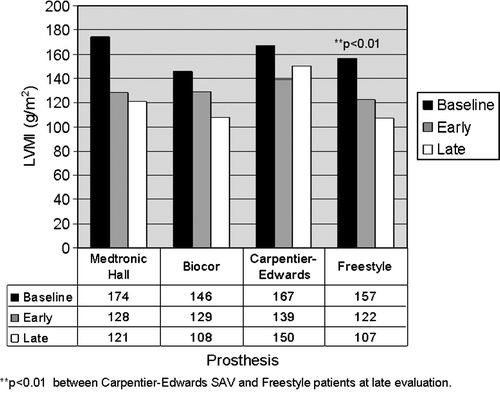
Figure 2.  Time course of LVMI regression post AVR.

Figure 2.  Time course of LVMI regression post AVR.

Table II.  Echocardiographic characteristics of hypertensive versus normotensive patients

Table III.  Predictors of LV hypertrophy regression during 18-month follow-up. Multiple regression analysis (multiple R2=0.68, p < 0.05).

Table IV.  Exercise capacity in hypertensive and normotensive patients.

Table V.  Predictors of improvement in exercise capacity in multiple regression analysis (multiple R2=0.37, p < 0.05).
Reprints and Corporate Permissions

Please note: Selecting permissions does not provide access to the full text of the article, please see our help page How do I view content?

To request a reprint or corporate permissions for this article, please click on the relevant link below:

Academic Permissions

Please note: Selecting permissions does not provide access to the full text of the article, please see our help page How do I view content?

Obtain permissions instantly via Rightslink by clicking on the button below:

If you are unable to obtain permissions via Rightslink, please complete and submit this Permissions form. For more information, please visit our Permissions help page.