Figures & data
Table I. Perfect ECG for QRS interpretation.
Figure 1. Examples of ECG recordings distorted by artefact provocations. Lines below the tracings indicate artefactual ECG. A and B: slight touching of the skin electrodes. C and D: teeth-brushing. E: rotation of the arms. In recording A, for example, some parts of the ECG are valueless for interpretation because of the concealment of ordinary P waves and QRS complexes. In recording B, QRS complexes but not P waves can be discerned.
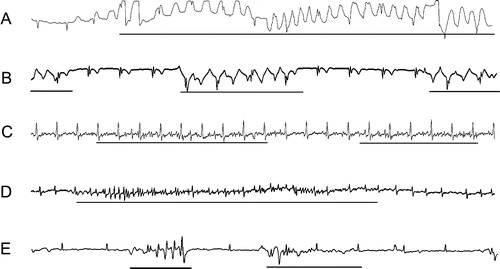
Figure 2. Mean percentage of categories of quality during different types of artefact provocation. QRS complexes without artefact prevention.
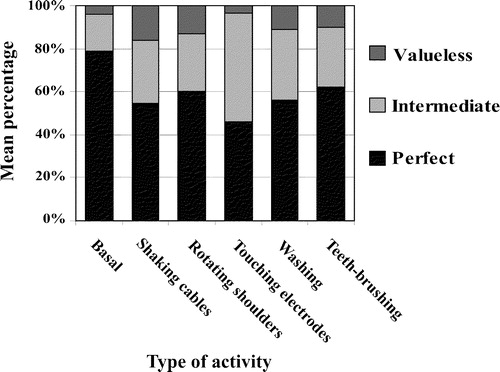
Figure 3. Mean percentage of categories of quality during different types of artefact provocation. P waves without artefact prevention.
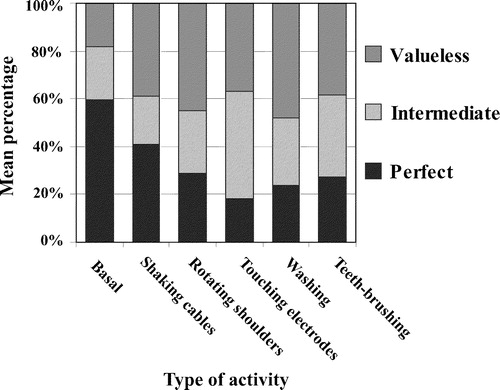
Table II. Valueless ECG for QRS interpretation.
Table III. Perfect ECG for P wave interpretation.
Table IV. Valueless ECG for P wave interpretation.