Figures & data
Table I. Total antioxidant activity and sex hormones in males and females groups of subject
Figure 1. Total antioxidant capacity (TAC) of male and female subjects. FM = female menopausal, FPM = female pre menopausal, MLT = male with lower testosterone, MN = male with normal testosterone. Values are means±SD for each group. *p<0.001
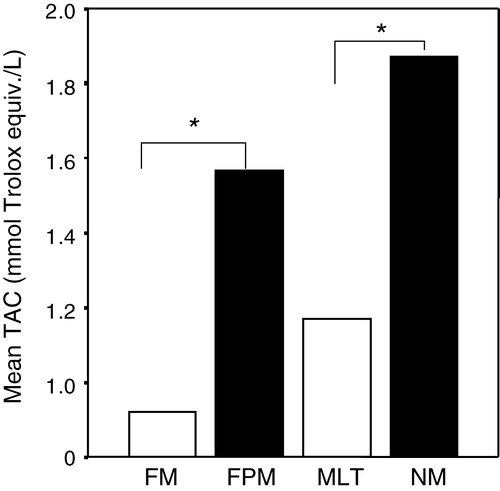
Figure 2a. The correlation between total antioxidant capacity (TAC) and total testosterone
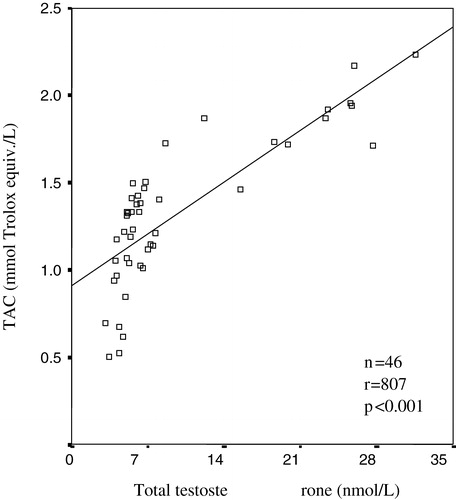
Figure 2b. The correlation between total antioxidant capacity (TAC) and estradiol
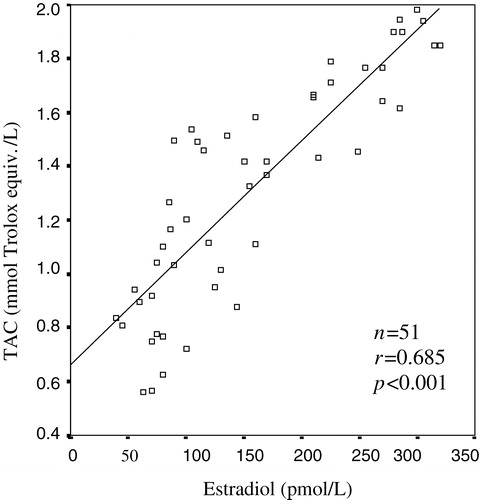
Table II. Bivariate and multivariate regression analyses for predicting for TAC in female and male subjects