Figures & data
Figure 1. Sagittal view over the thoracic aorta. The figure shows were the measurement were made. AV = the level of the aortic valve, AV20 = 20 mm over the aortic valve, AV40 = 40 mm over the aortic valve, AD40 – AD20 – ADV = corresponding levels in the descending aorta.
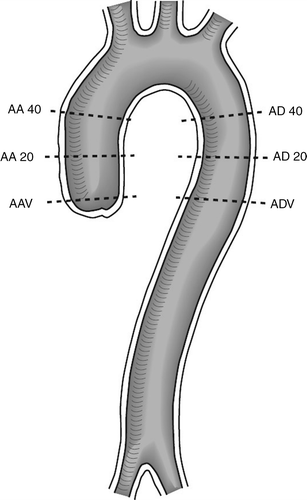
Table I. Results of the multivariate analyses. In the age-sex-BMI model, sex did not add significantly to the model. In the age-sex model, sex did not add significantly to the model. SE: standard error. CV: coefficient of variation.
Figure 2. Normal diameter and upper limit for ascending and descending aorta related to age.
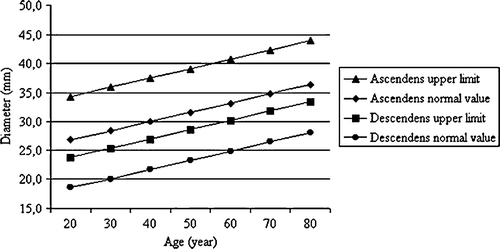
Table II. Formulae for calculating the upper limit for thoracic aorta