176
Views
5
CrossRef citations to date
0
Altmetric
ORIGINAL ARTICLE

Association between glycometabolic status in the acute phase and 2½ years after an acute coronary syndrome

, , , , , & show all
Pages 145-151 | Received 01 Jan 2005, Published online: 12 Jul 2009

Figures & data

Figure 1.  Flow chart of studied patients (ACS = acute coronary syndrome; DM = diabetes mellitus; STEMI = ST-segment elevation myocardial infarction; NSTEMI = non-ST-segment elevation myocardial infarction; UAP = unstable angina pectoris).
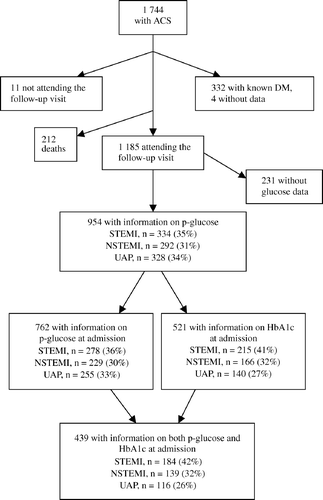
Figure 1.  Flow chart of studied patients (ACS = acute coronary syndrome; DM = diabetes mellitus; STEMI = ST-segment elevation myocardial infarction; NSTEMI = non-ST-segment elevation myocardial infarction; UAP = unstable angina pectoris).

Table I.  Clinical characteristics and discharge diagnosis by admission plasma glucose concentrations

Figure 2.  Glycometabolic status (NFG = normal fasting glucose; IFG = impaired fasting glucose; DM = diabetes mellitus) at 2½ year follow-up, after classification according to admission plasma glucose levels (group 1 = patients with plasma glucose < 6.1 mmol/l; group 2 = patients with plasma glucose 6.1 – 6.9 mmol/l; group 3 = patients with plasma glucose ≥ 7.0 mmol/l).
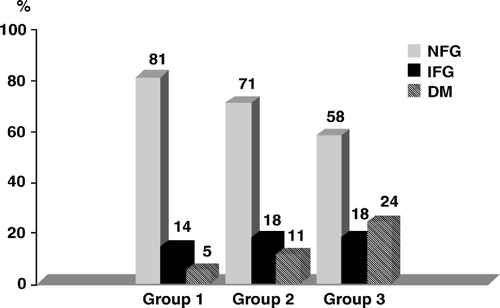
Figure 2.  Glycometabolic status (NFG = normal fasting glucose; IFG = impaired fasting glucose; DM = diabetes mellitus) at 2½ year follow-up, after classification according to admission plasma glucose levels (group 1 = patients with plasma glucose < 6.1 mmol/l; group 2 = patients with plasma glucose 6.1 – 6.9 mmol/l; group 3 = patients with plasma glucose ≥ 7.0 mmol/l).

Figure 3.  Glycometabolic status (NFG = normal fasting glucose; IFG = impaired fasting glucose; DM = diabetes mellitus) at 2½ year follow-up, after classification according to admission HbA1c (group 1 = patients with HbA1c ≤ 4.5%; group 2 = patients with HbA1c 4.6–5.4%; group 3 = patients with HbA1c ≥ 5.5%).
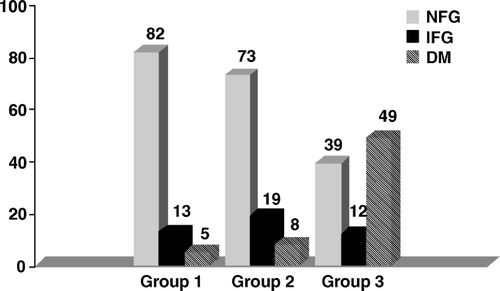
Figure 3.  Glycometabolic status (NFG = normal fasting glucose; IFG = impaired fasting glucose; DM = diabetes mellitus) at 2½ year follow-up, after classification according to admission HbA1c (group 1 = patients with HbA1c ≤ 4.5%; group 2 = patients with HbA1c 4.6–5.4%; group 3 = patients with HbA1c ≥ 5.5%).

Reprints and Corporate Permissions

Please note: Selecting permissions does not provide access to the full text of the article, please see our help page How do I view content?

To request a reprint or corporate permissions for this article, please click on the relevant link below:

Academic Permissions

Please note: Selecting permissions does not provide access to the full text of the article, please see our help page How do I view content?

Obtain permissions instantly via Rightslink by clicking on the button below:

If you are unable to obtain permissions via Rightslink, please complete and submit this Permissions form. For more information, please visit our Permissions help page.