454
Views
53
CrossRef citations to date
0
Altmetric
Original

Limb ischemic postconditioning protects myocardium from ischemia-reperfusion injury

, , &
Pages 312-317 | Received 23 Apr 2006, Published online: 12 Jul 2009

Figures & data

Table I.  HR (bpm) during ischemia and reperfusion

Table II.  MAP (mmHg) during ischemia and reperfusion

Figure 1.  Bar graph showing area at risk (AAR) expressed as a percentage of the left ventricle (LV) and area of necrosis (AN) expressed as a percentage of the AAR. Pre-con = Ischemic Preconditioning; Post-con = Ischemic Postconditioning; Re Post-con = Remote Postconditioning. Re Post-con significantly reduced AN/AAR ratio by 46% compared with Control, showing equivalent cardioprotection to that of Pre-con and Post-con. *p < 0.01 Pre-con, Post-con and Re Post-con vs. Control. Values are means±SD
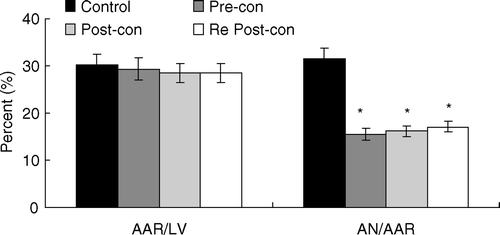
Figure 1.  Bar graph showing area at risk (AAR) expressed as a percentage of the left ventricle (LV) and area of necrosis (AN) expressed as a percentage of the AAR. Pre-con = Ischemic Preconditioning; Post-con = Ischemic Postconditioning; Re Post-con = Remote Postconditioning. Re Post-con significantly reduced AN/AAR ratio by 46% compared with Control, showing equivalent cardioprotection to that of Pre-con and Post-con. *p < 0.01 Pre-con, Post-con and Re Post-con vs. Control. Values are means±SD

Figure 2.  Line graph showing plasma creatine kinase (CK) activity during the course of experiment. Base = baseline; Isch = end of ischemia; Pre-con = Ischemic Preconditioning; Post-con = Ischemic Postconditioning; R3h = 3 h of reperfusion; Re Post-con = Remote Postconditioning. Plasma CK activity at 3 h of reperfusion was significantly lower in Pre-con, Post-con and Re Post-con than that in Control. There was no statistical difference between Pre-con, Post-con and Re Post-con. *p < 0.01, Control vs. Pre-con, Post-con and Re Post-con at 3 h of reperfusion. Values are means±SD.
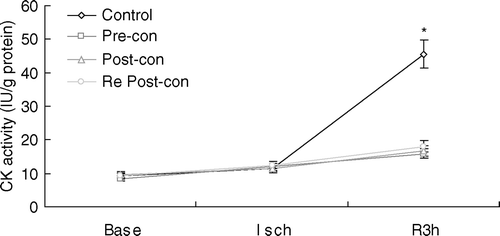
Figure 2.  Line graph showing plasma creatine kinase (CK) activity during the course of experiment. Base = baseline; Isch = end of ischemia; Pre-con = Ischemic Preconditioning; Post-con = Ischemic Postconditioning; R3h = 3 h of reperfusion; Re Post-con = Remote Postconditioning. Plasma CK activity at 3 h of reperfusion was significantly lower in Pre-con, Post-con and Re Post-con than that in Control. There was no statistical difference between Pre-con, Post-con and Re Post-con. *p < 0.01, Control vs. Pre-con, Post-con and Re Post-con at 3 h of reperfusion. Values are means±SD.
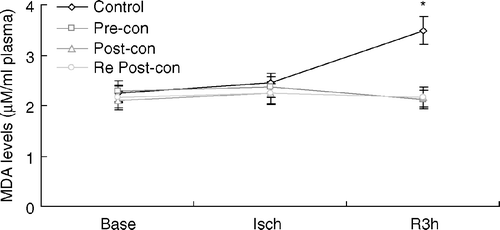
Figure 3.  Line graph showing plasma malondialdehyde (MDA) levels during the course of experiment. Base = baseline; Isch = end of ischemia; Pre-con = Ischemic Preconditioning; Post-con = Ischemic Postconditioning; R3h = 3 h of reperfusion; Re Post-con = Remote Postconditioning. There was no significant difference among the four groups at baseline and after 30 min of ischemia. However, plasma MDA was significantly greater in Control at R3h compared to Pre-con, Post-con and Re Post-con. *p < 0.01, Control vs. Pre-con, Post-con and Re Post-con at 3 h of reperfusion. Values are means±SD.

Figure 3.  Line graph showing plasma malondialdehyde (MDA) levels during the course of experiment. Base = baseline; Isch = end of ischemia; Pre-con = Ischemic Preconditioning; Post-con = Ischemic Postconditioning; R3h = 3 h of reperfusion; Re Post-con = Remote Postconditioning. There was no significant difference among the four groups at baseline and after 30 min of ischemia. However, plasma MDA was significantly greater in Control at R3h compared to Pre-con, Post-con and Re Post-con. *p < 0.01, Control vs. Pre-con, Post-con and Re Post-con at 3 h of reperfusion. Values are means±SD.

Figure 4.  Bar graph showing myeloperoxidase (MPO) activity in the NIZ and AAR. AAR = area at risk; NIZ = nonischemic zone; Pre-con = Ischemic Preconditioning; Post-con = Ischemic Postconditioning; Re Post-con = Remote Postconditioning. MPO activity in the NIZ was low and comparable among the four groups. However, MPO activity in the AAR was significantly less in Pre-con, Post-con and Re Post-con than that in Control. MPO activity in the AAR of Pre-con was significantly lower than that of Post-con and Re Post-con. *p < 0.01 Pre-con, Post-con and Re Post-con vs. Control. #p < 0.05 Post-con and Re Post-con vs. Pre-con. Values are means±SD.
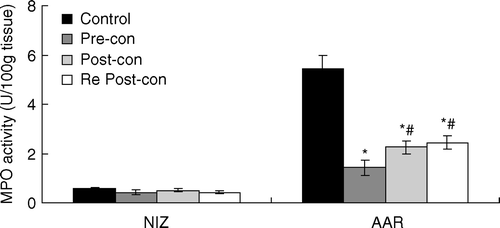
Figure 4.  Bar graph showing myeloperoxidase (MPO) activity in the NIZ and AAR. AAR = area at risk; NIZ = nonischemic zone; Pre-con = Ischemic Preconditioning; Post-con = Ischemic Postconditioning; Re Post-con = Remote Postconditioning. MPO activity in the NIZ was low and comparable among the four groups. However, MPO activity in the AAR was significantly less in Pre-con, Post-con and Re Post-con than that in Control. MPO activity in the AAR of Pre-con was significantly lower than that of Post-con and Re Post-con. *p < 0.01 Pre-con, Post-con and Re Post-con vs. Control. #p < 0.05 Post-con and Re Post-con vs. Pre-con. Values are means±SD.

Reprints and Corporate Permissions

Please note: Selecting permissions does not provide access to the full text of the article, please see our help page How do I view content?

To request a reprint or corporate permissions for this article, please click on the relevant link below:

Academic Permissions

Please note: Selecting permissions does not provide access to the full text of the article, please see our help page How do I view content?

Obtain permissions instantly via Rightslink by clicking on the button below:

If you are unable to obtain permissions via Rightslink, please complete and submit this Permissions form. For more information, please visit our Permissions help page.