Figures & data
Figure 1. Kaplan-Meier estimate of unadjusted survival in the two strategy groups. The difference is not statistical significant (p = 0.93 – logrank test).
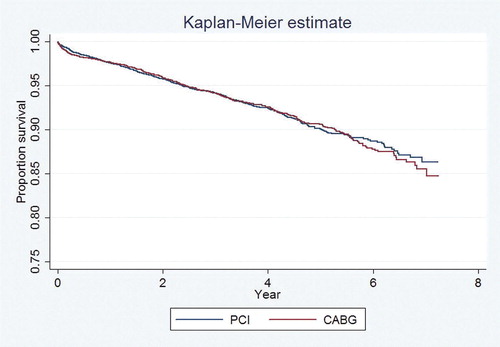
Table I. Baseline characteristics.
Figure 2. Survival curves from final Cox model in diabetics with one and two vessel disease. Hazard ratio for CABG versus PCI is 0.66 (99.5% CI 0.36–1.23). The difference is statistically of borderline significance (p = 0.064).
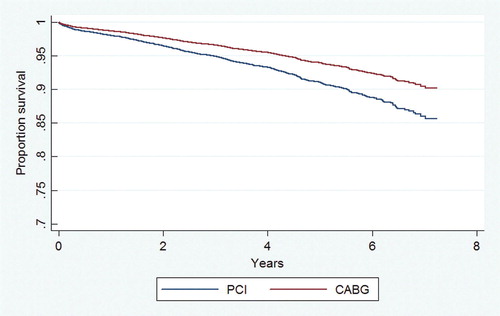
Figure 3. Survival curves from final Cox model in non diabetics with three vessel disease. Hazard ratio for CABG versus PCI is 0.61 (99.5% CI 0.46–0.80). The difference is statistically different (p < 0.001, Bonferroni adjusted).
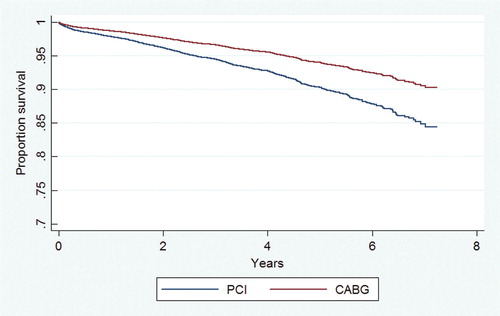
Figure 4. Survival curves from final Cox model in diabetics with three vessel disease. Hazard ratio for CABG versus PCI is 0.40 (99.5% CI 0.24–0.67). The difference is statistically different (p < 0.001, Bonferroni adjusted).
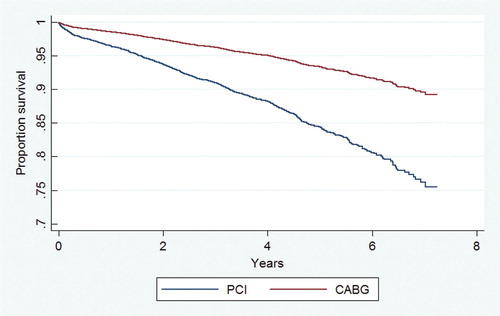
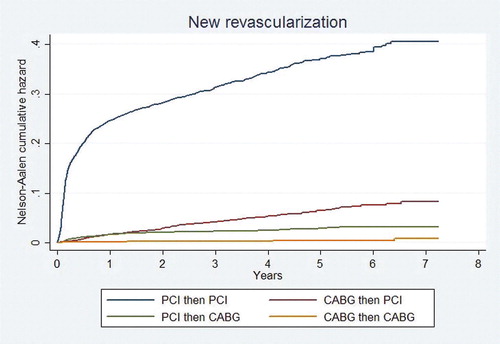
Figure 5. Estimated frequency of first reintervention between initial strategy and type of new intervention. The logrank test for initial strategy and any subsequent reintervention was highly significant (p < 0.001).