208
Views
7
CrossRef citations to date
0
Altmetric
Original Article

α-2 adrenergic antagonism enhances risk of ventricular tachycardia during acute ischemia

, &
Pages 378-385 | Received 20 Mar 2007, Published online: 12 Jul 2009

Figures & data

Figure 1.  Electrograms during a ventricular pacing protocol (last in the drive, S1 and two prematures, S2 S3) followed by 3 VT complexes (vertical lines indicate the onset of surface ECG of VT complexes). Shown are surface ECG tracing lead II, and electrograms from Purkinje (P) or overlying endocardial (E) recording sites at focus of origin (P-F) and from west (P-W), north (E-N), south (P-S), southwest (P-SW), and east (E-E) of the focus. During pacing Purkinje potentials are indicated by downward arrows; all Purkinje potentials show delay with S2 and S3 with the greatest delay seen in P-SW, which in being greater than the cycle length between S3 and VT1, could suggest reentry within the Purkinje network. This delay argues for Purkinje origin of the potentials since the expected refractory period of Purkinje system would be greater than overlying endocardium. A similar delay is recorded in P-S and both recordings also are delayed between VT1 and VT2 (upward arrows), also suggesting possible reentry within the Purkinje system. VT3 complex originates from a Purkinje focus (P-F, with no major delay from VT2). An alternative explanation is that all three VT complexes originate from a focus at P-F.

Figure 1.  Electrograms during a ventricular pacing protocol (last in the drive, S1 and two prematures, S2 S3) followed by 3 VT complexes (vertical lines indicate the onset of surface ECG of VT complexes). Shown are surface ECG tracing lead II, and electrograms from Purkinje (P) or overlying endocardial (E) recording sites at focus of origin (P-F) and from west (P-W), north (E-N), south (P-S), southwest (P-SW), and east (E-E) of the focus. During pacing Purkinje potentials are indicated by downward arrows; all Purkinje potentials show delay with S2 and S3 with the greatest delay seen in P-SW, which in being greater than the cycle length between S3 and VT1, could suggest reentry within the Purkinje network. This delay argues for Purkinje origin of the potentials since the expected refractory period of Purkinje system would be greater than overlying endocardium. A similar delay is recorded in P-S and both recordings also are delayed between VT1 and VT2 (upward arrows), also suggesting possible reentry within the Purkinje system. VT3 complex originates from a Purkinje focus (P-F, with no major delay from VT2). An alternative explanation is that all three VT complexes originate from a focus at P-F.

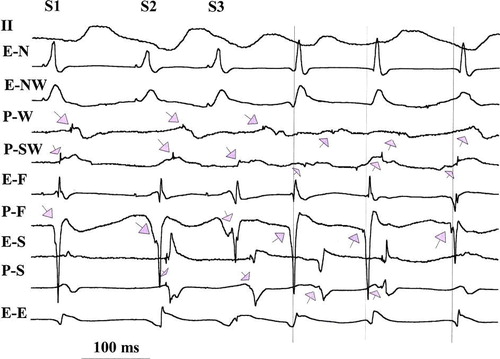
Figure 2.  3-D activation mapping of second VT complex shown in the electrograms in . Maps are shown in six layers each representing epicardial (EPI), subepicardial (S-EPI), midwall, subendocardial (S-ENDO), endocardial (ENDO) and Purkinje (PURK) planes. Activation times are in ms at each recording site. Maps are drawn in 20 ms isochrones (different colors, with pink the earliest, then yellow, red, sky blue, orange, green, lavender and dark blue representing the latest activation). Earliest activity is seen in the PURK layer (−28 ms) with activation then proceeding out to EPI. Activation of the Purkinje layer is slow with late activity (34 ms) recorded adjacent to the early, suggesting possible reentry in the Purkinje layer.

Figure 2.  3-D activation mapping of second VT complex shown in the electrograms in Figure 1. Maps are shown in six layers each representing epicardial (EPI), subepicardial (S-EPI), midwall, subendocardial (S-ENDO), endocardial (ENDO) and Purkinje (PURK) planes. Activation times are in ms at each recording site. Maps are drawn in 20 ms isochrones (different colors, with pink the earliest, then yellow, red, sky blue, orange, green, lavender and dark blue representing the latest activation). Earliest activity is seen in the PURK layer (−28 ms) with activation then proceeding out to EPI. Activation of the Purkinje layer is slow with late activity (34 ms) recorded adjacent to the early, suggesting possible reentry in the Purkinje layer.

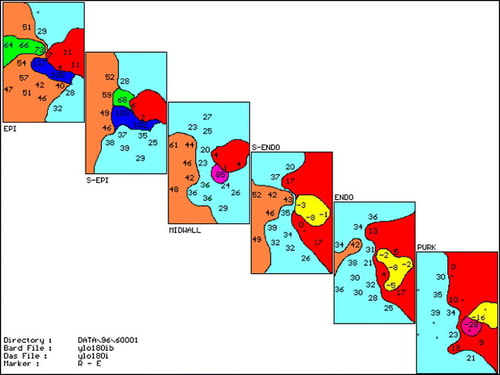
Figure 3.  Same format as in . Map of third VT complex seen in the electrograms in . Note earliest Purkinje activation at −18 ms with much less delay to adjacent areas than , suggesting focal Purkinje origin of third VT complex. If viewed alone, the epicardium would suggest a reentrant excitation with early site at −11 ms next to late site 89 ms.

Figure 3.  Same format as in Figure 2. Map of third VT complex seen in the electrograms in Figure 1. Note earliest Purkinje activation at −18 ms with much less delay to adjacent areas than Figure 2, suggesting focal Purkinje origin of third VT complex. If viewed alone, the epicardium would suggest a reentrant excitation with early site at −11 ms next to late site 89 ms.

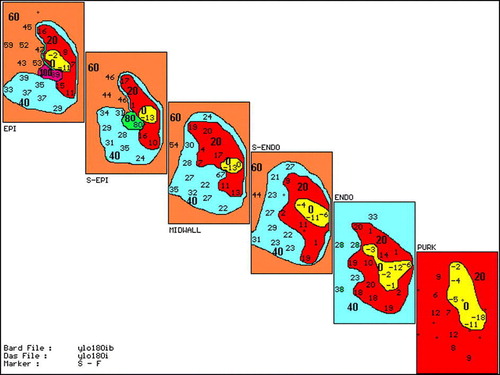
Table I.  Characteristics and mechanism of VTs induced with yohimbine.

Reprints and Corporate Permissions

Please note: Selecting permissions does not provide access to the full text of the article, please see our help page How do I view content?

To request a reprint or corporate permissions for this article, please click on the relevant link below:

Academic Permissions

Please note: Selecting permissions does not provide access to the full text of the article, please see our help page How do I view content?

Obtain permissions instantly via Rightslink by clicking on the button below:

If you are unable to obtain permissions via Rightslink, please complete and submit this Permissions form. For more information, please visit our Permissions help page.