230
Views
1
CrossRef citations to date
0
Altmetric
Original Article

Surgical handling of saphenous vein grafts induces expression of matrix metalloproteinase 9

, , , &
Pages 327-336 | Received 14 Nov 2007, Published online: 12 Jul 2009

Figures & data

Table I.  The clinical characteristic of patients with stable and unstable angina undergoing acute or elective coronary artery bypass grafting with sampling of saphenous veins used in the present study.

Table II.  Some surgical characteristics of patients with stable and unstable angina undergoing acute or elective coronary artery bypass grafting with sampling of saphenous veins used in the present study.

Figure 1.  A representative polyacrylamide gel with RT-PCR products of MMP9 from human saphenous veins sampled before and after surgical preparation for CABG from patients with stable (SA) or unstable angina (UA). The band densities were measured and the ratio between test genes and reference gene H3 were calculated in total of 24 patients (12 stable, 12 unstable). MMP9 gene expression for stable and unstable patient groups jointly and separately is illustrated by dot-plots, showing the individual change from the first to the second biopsy. The difference in MMP9 between the second and first biopsy is illustrated by a box-plot for each group. Gene expression of MMP9 was increased after surgical handling in all patients. When the patients were subdivided into populations of stable and unstable angina, MMP9 gene expression was significantly increased in veins from stable, but not unstable patients. Note that the scale of relative gene expression on the dot-plots are different.
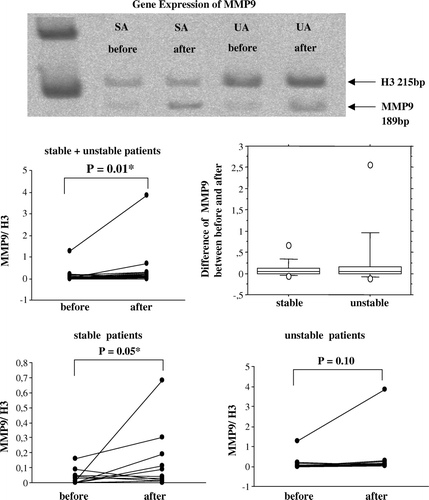
Figure 1.  A representative polyacrylamide gel with RT-PCR products of MMP9 from human saphenous veins sampled before and after surgical preparation for CABG from patients with stable (SA) or unstable angina (UA). The band densities were measured and the ratio between test genes and reference gene H3 were calculated in total of 24 patients (12 stable, 12 unstable). MMP9 gene expression for stable and unstable patient groups jointly and separately is illustrated by dot-plots, showing the individual change from the first to the second biopsy. The difference in MMP9 between the second and first biopsy is illustrated by a box-plot for each group. Gene expression of MMP9 was increased after surgical handling in all patients. When the patients were subdivided into populations of stable and unstable angina, MMP9 gene expression was significantly increased in veins from stable, but not unstable patients. Note that the scale of relative gene expression on the dot-plots are different.

Figure 2.  A representative immunoblot showing protein extracts from human saphenous veins sampled before and after surgical preparation for CABG from patients with stable (SA) or unstable angina (UA). MMP9 protein is illustrated by dot-plots, showing the individual change from the first to the second biopsy for stable (n = 5) and unstable patient groups (n = 6) jointly and separately. The ratio between the second and first value is shown by a box-plot for each group. Protein expression of MMP9 was increased by surgical handling of the veins of all patients. When the patients were subdivided into groups according to plaque stability, an increase of MMP9 was found after surgical vein graft handling in stable patients, while this difference becomes smaller in veins from unstable patients. In the stable group the log-scale-estimated population factor of increase (ratio After/Before) is 2.2, with a 95% confidence interval of (1.4, 3.4). Note that the scale of relative protein expression on the dot-plots are different.
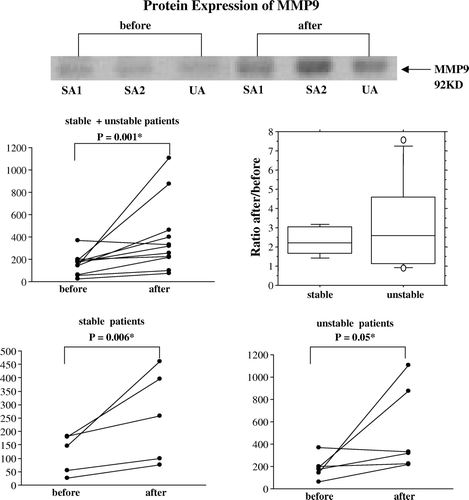
Figure 2.  A representative immunoblot showing protein extracts from human saphenous veins sampled before and after surgical preparation for CABG from patients with stable (SA) or unstable angina (UA). MMP9 protein is illustrated by dot-plots, showing the individual change from the first to the second biopsy for stable (n = 5) and unstable patient groups (n = 6) jointly and separately. The ratio between the second and first value is shown by a box-plot for each group. Protein expression of MMP9 was increased by surgical handling of the veins of all patients. When the patients were subdivided into groups according to plaque stability, an increase of MMP9 was found after surgical vein graft handling in stable patients, while this difference becomes smaller in veins from unstable patients. In the stable group the log-scale-estimated population factor of increase (ratio After/Before) is 2.2, with a 95% confidence interval of (1.4, 3.4). Note that the scale of relative protein expression on the dot-plots are different.

Figure 3a.  A representative zymography gel shows the pro-MMP9 and activated MMP9 in tissue extracts from human saphenous veins sampled at the start of and end of surgical preparation for CABG from two patients with stable (SA) and one patient with unstable angina (UA). proMMP9 as well as active MMP9 are illustrated by dot-plots, showing the individual change from the first to the second biopsy for patients with stable (n = 5) and unstable (n = 7) angina pectoris. The ratio between the second and first value is shown as a box-plot for each group. Pro-MMP9, but not active MMP9, was increased in all patients after surgical handling. For proMMP9 the log-scale-estimated population factor of increase (ratio After/Before) was 1.4, with a 95% confidence interval of (1.0, 1.9). For active MMP9 the corresponding estimate was 1.2, with confidence interval (1.0, 1.4). Note that the scale of pro- and active MMP9 on the dot-plots are different.
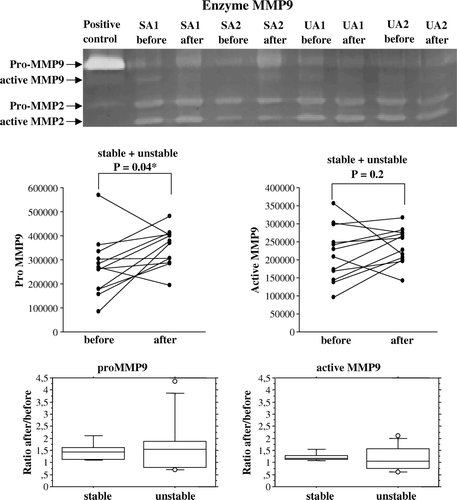
Figure 3a.  A representative zymography gel shows the pro-MMP9 and activated MMP9 in tissue extracts from human saphenous veins sampled at the start of and end of surgical preparation for CABG from two patients with stable (SA) and one patient with unstable angina (UA). proMMP9 as well as active MMP9 are illustrated by dot-plots, showing the individual change from the first to the second biopsy for patients with stable (n = 5) and unstable (n = 7) angina pectoris. The ratio between the second and first value is shown as a box-plot for each group. Pro-MMP9, but not active MMP9, was increased in all patients after surgical handling. For proMMP9 the log-scale-estimated population factor of increase (ratio After/Before) was 1.4, with a 95% confidence interval of (1.0, 1.9). For active MMP9 the corresponding estimate was 1.2, with confidence interval (1.0, 1.4). Note that the scale of pro- and active MMP9 on the dot-plots are different.

Figure 3b.  The patients shown in were subdivided into populations with stable and unstable angina, and the values of pro- and active MMP9 are shown as dot-plots. An increase of pro- and active MMP9 was found after surgical vein graft handling in stable patients, while this was blunted in veins from unstable patients.
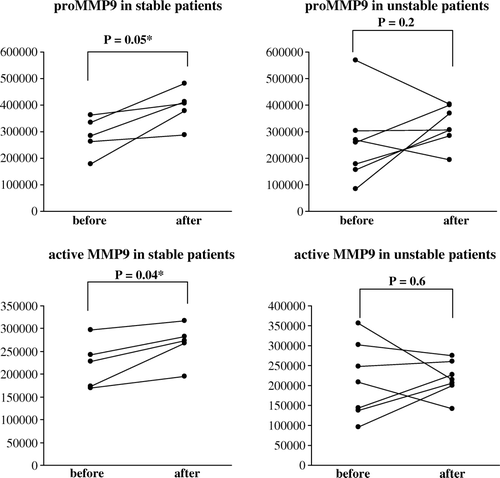
Figure 3b.  The patients shown in Figure 3A were subdivided into populations with stable and unstable angina, and the values of pro- and active MMP9 are shown as dot-plots. An increase of pro- and active MMP9 was found after surgical vein graft handling in stable patients, while this was blunted in veins from unstable patients.

Reprints and Corporate Permissions

Please note: Selecting permissions does not provide access to the full text of the article, please see our help page How do I view content?

To request a reprint or corporate permissions for this article, please click on the relevant link below:

Academic Permissions

Please note: Selecting permissions does not provide access to the full text of the article, please see our help page How do I view content?

Obtain permissions instantly via Rightslink by clicking on the button below:

If you are unable to obtain permissions via Rightslink, please complete and submit this Permissions form. For more information, please visit our Permissions help page.