1,752
Views
8
CrossRef citations to date
0
Altmetric
Original Article

Abnormal T-wave axis is associated with coronary artery calcification in older adults

, , , , , , , , & show all
Pages 240-248 | Received 14 May 2008, Published online: 13 Aug 2009

Figures & data

Table I.  Median, range of CAC scores by gender-specific CAC quartile: AGES-Reykjavik study

Table II.  Demographic and risk factor data by gender-specific CAC quartile, entire population: AGES-Reykjavik study

Table III.  Selected ECG criteria by gender-specific CAC quartile, entire population: AGES-Reykjavik study*

Supplementary Figure.  Mean frontal T-Axis deviation from 45° by CAC quartile, men free of CHD. Bars represent 95% confidence interval.
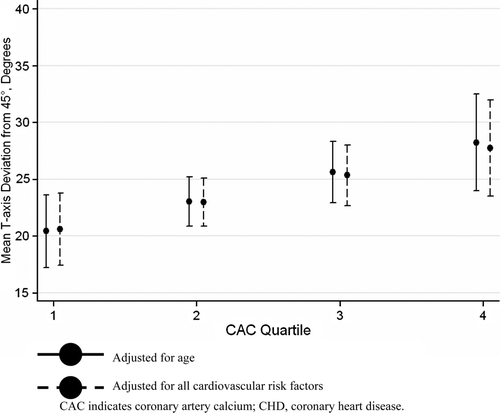
Supplementary Figure.  Mean frontal T-Axis deviation from 45° by CAC quartile, men free of CHD. Bars represent 95% confidence interval.

Table IV.  Mean frontal T-axis deviation from 45° by CAC quartile

Table V.  Odds (95%CI) for selected ECG criteria by increasing CAC quartile*

Reprints and Corporate Permissions

Please note: Selecting permissions does not provide access to the full text of the article, please see our help page How do I view content?

To request a reprint or corporate permissions for this article, please click on the relevant link below:

Academic Permissions

Please note: Selecting permissions does not provide access to the full text of the article, please see our help page How do I view content?

Obtain permissions instantly via Rightslink by clicking on the button below:

If you are unable to obtain permissions via Rightslink, please complete and submit this Permissions form. For more information, please visit our Permissions help page.