187
Views
1
CrossRef citations to date
0
Altmetric
Original Article

Restenosis in coronary bare metal stents. Importance of time to follow-up: A comparison of coronary angiograms 6 months and 4 years after implantation

, , , , , , , & show all
Pages 87-93 | Received 15 Jul 2008, Published online: 12 Jul 2009

Figures & data

Table I.  Baseline characteristics

Figure 1.  Kaplan Meier distribution of major adverse events Any event=the composite of death (cardiac and non-cardiac), coronary artery bypass surgery, any percutaneous coronary intervention (target segment and non-target segment) and myocardial infarction.
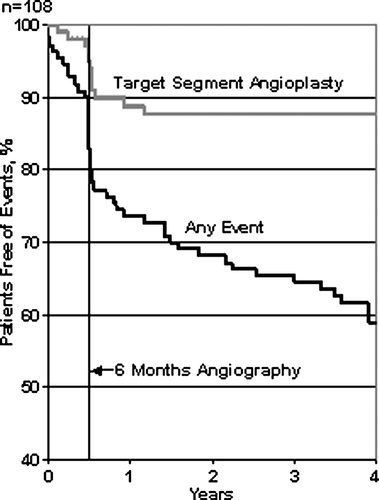
Figure 1.  Kaplan Meier distribution of major adverse events Any event=the composite of death (cardiac and non-cardiac), coronary artery bypass surgery, any percutaneous coronary intervention (target segment and non-target segment) and myocardial infarction.

Table II.  Number of major adverse events in patients with and without paired 6 months and 4 years angiograms

Table III.  Angiographic baseline data in patients with and without paired 6 months and 4 years angiogram

Table IV.  Angiographic results in patients with 4 years follow-up

Figure 2.  The expected binary restenosis rate The curve to the right is the cumulative distribution of diameter stenosis in all patients in the DANSTENT study Citation10. In the curve to the left, the expected 4 years cumulative distribution of diameter stenosis, is calculated by subtracting the expected late restenosis regression of 6.15% for each patient. The binary restenosis rates (% of patients with ≥50% diameter stenosis) at 6 months follow-up and at 4 years follow-up are indicated with the arrows
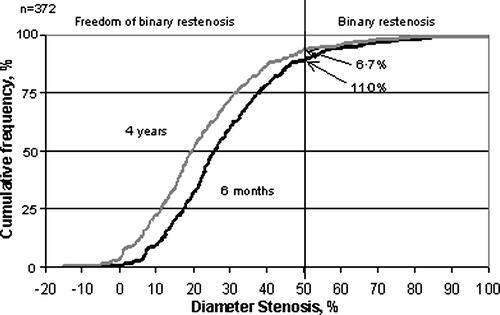
Figure 2.  The expected binary restenosis rate The curve to the right is the cumulative distribution of diameter stenosis in all patients in the DANSTENT study Citation10. In the curve to the left, the expected 4 years cumulative distribution of diameter stenosis, is calculated by subtracting the expected late restenosis regression of 6.15% for each patient. The binary restenosis rates (% of patients with ≥50% diameter stenosis) at 6 months follow-up and at 4 years follow-up are indicated with the arrows

Reprints and Corporate Permissions

Please note: Selecting permissions does not provide access to the full text of the article, please see our help page How do I view content?

To request a reprint or corporate permissions for this article, please click on the relevant link below:

Academic Permissions

Please note: Selecting permissions does not provide access to the full text of the article, please see our help page How do I view content?

Obtain permissions instantly via Rightslink by clicking on the button below:

If you are unable to obtain permissions via Rightslink, please complete and submit this Permissions form. For more information, please visit our Permissions help page.