Figures & data
Figure 1. Mesenchymal stromal cells – mechanisms of action. (Reprint from Singer NG and Caplan AL. Mesenchymal stem cells: mechanisms of inflammation. Annu Rev Pathol. 2011; 6:457–78. With permission from Annual Reviews).
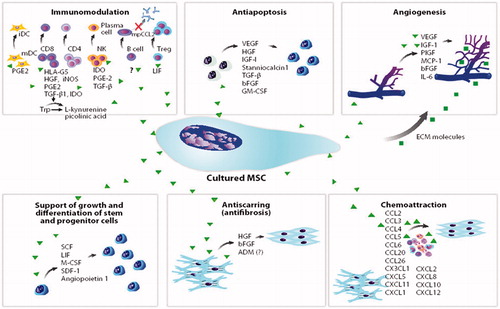
Table 1. Mesenchymal stromal cells in patients with acute myocardial infarction.
Figure 2. Hospital admission rates per patient from 3 years before treatment to 3 years after treatment. NS: non-significant; PCI: percutane coronary intervention; UAP: unstable angina pectoris; AMI: acute myocardial infarction. (Reprinted from Mathiasen et al. Int J Cardiol. 2013 Dec 10;170(2):246–51) with permission from Elsevier).
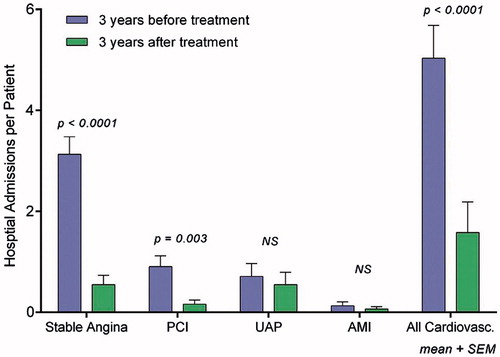
Table 2. Mesenchymal stem cells in patients with chronic ischemic heart disease.
Figure 3. Differences in cardiac function from baseline to 6-month follow-up. (A) End-systolic volume, (B) end-diastolic volume, (C) ejection fraction, (D) stroke volume, (E) cardiac output, (F) myocardial mass, and (G) scar tissue (Paired t-test. Bar values are mean ±95% confidence intervals). (Reprinted from Mathiasen et al. Eur Heart J. 2015 Jul 14;36(27):1744–53 with permission from Oxford University Press).
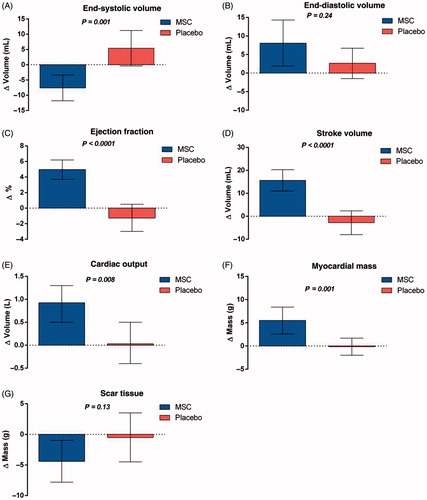
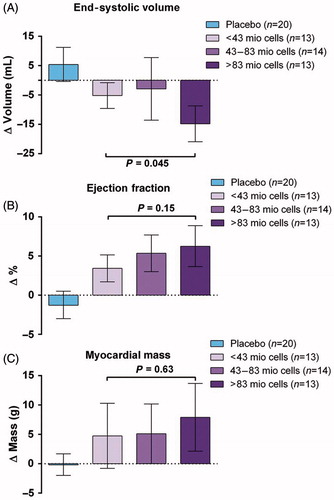
Figure 4. Dose–response effects: (A) end-systolic volume, (B) ejection fraction, and (C) mean myocardial mass. p Values represent the differences between subgroups of the mesenchymal stromal cell group (one-way ANOVA. Bar values are mean ±95% confidence intervals). (Reprinted from Mathiasen et al. Eur Heart J. 2015 Jul 14;36(27):1744–53 with permission from Oxford University Press).