Figures & data
Figure 1. A schematic illustration presenting lead V6 of an ECG with delayed intrinsicoid deflection (time from the onset of the QRS complex to R-wave peak in lead V5 or V6 ≥ 0.05s). The paper speed is 50 mm/s.
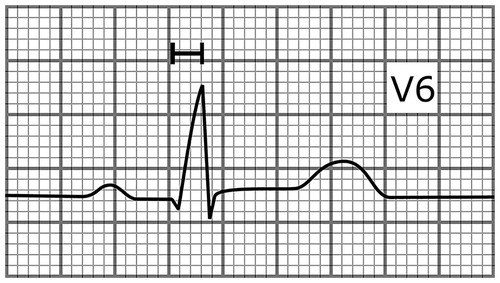
Figure 2. An ECG of a 41-year-old male who hadn’t been diagnosed with cardiac disease showing an ER pattern in the inferior and lateral leads. The subject died of SCD after 25 years of follow-up. The paper speed is 50 mm/s.
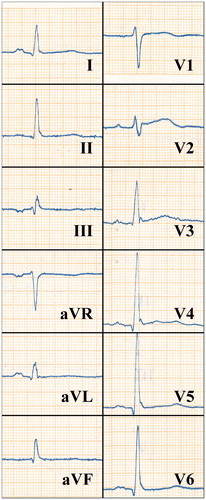
Table 1. Examples of studies assessing the SCD risk associated with electrocardiographic abnormalities in the general population.
Figure 3. A schematic illustration showing a heartbeat with different JT intervals. The J-point to T peak interval is short in SQTS (red curve, 110 ms) but close to normal in subjects with short-QT interval without the syndrome (black curve, 180 ms).
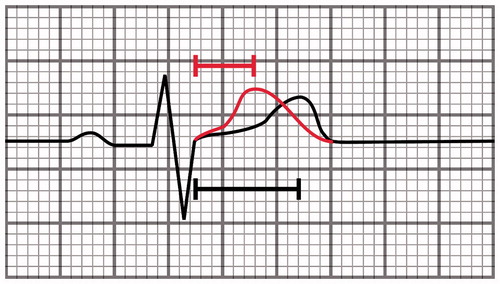
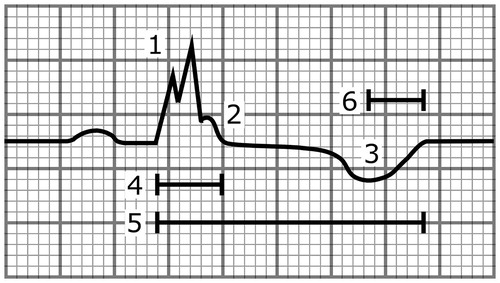
Figure 4. A schematic illustration showing a heartbeat with multiple abnormalities that are associated with increased SCD risk. These include (1) the fragmentation of the QRS complex, (2) the notched ER pattern with a downsloping ST segment, (3) the T-wave inversion directed to the opposite direction from the QRS complex, (4) the wide QRS complex (110 ms), (5) the long-QT interval (500 ms), and (6) the long T-peak to T-end interval (105 ms). The paper speed is 50 mm/s.