Figures & data
Figure 1. Feasibility of identifying genetic variants by risk allele frequency and strength of genetic effect (odds ratio). Adapted from Manolio T, et al., Nature 2009;461(7265):747–753, with permission.
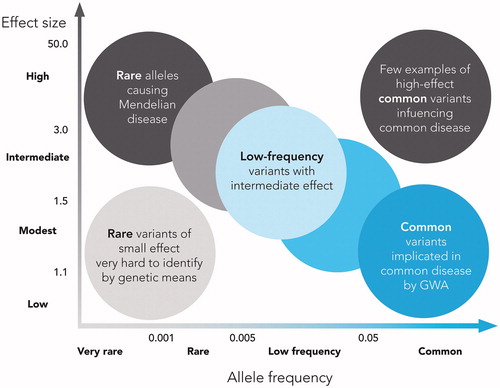
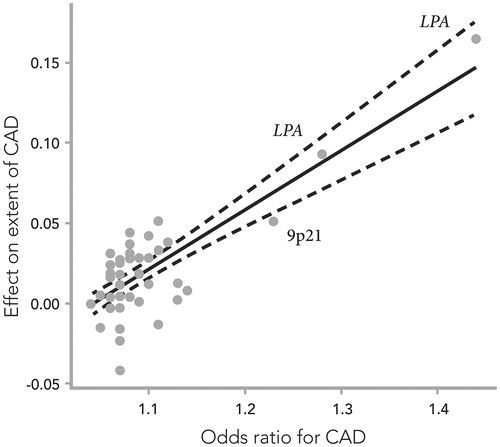
Figure 2. The effects of 50 single-nucleotide polymorphisms (SNPs) on the extent of coronary artery disease (CAD), expressed as the increase in number of diseased coronary arteries (with at least 50% stenosis) per SNP risk allele, plotted against their respective effect on CAD risk (odds ratio), previously reported in meta-analyses of genome-wide association studies. Combined effect sizes in the Icelandic and Emory Biobank samples are presented where available. The solid line denotes best linear fit, and the dashed lines indicate 95% confidence limits. Adapted from ref. Citation32.