
Figures & data
Table 1. Study population.
Figure 1. Numbers of first conduit procedures by date (n = 572). The peak of operations in the late 1990s is explained by a cluster of Ross operations.
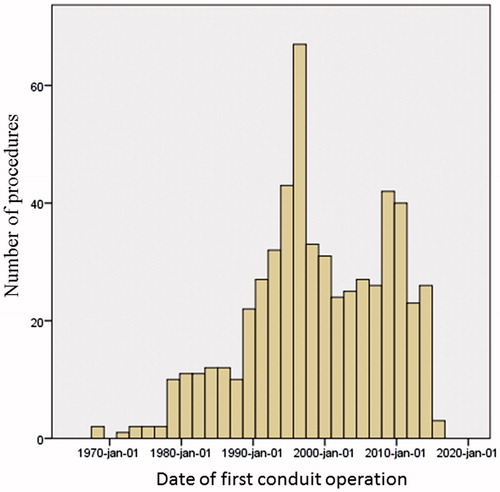
Figure 2. Kaplan-Meier estimate of patient survival after first conduit operation. Early postoperative deaths are included (n = 3). Mean age at first conduit operation was 20.2 years (95% confidence interval: 18.9–21.6); median age was 16.2 years. In up to 48 years follow-up from first conduit operation, 238 conduit reoperations and TPVRs were conducted in the cohort.
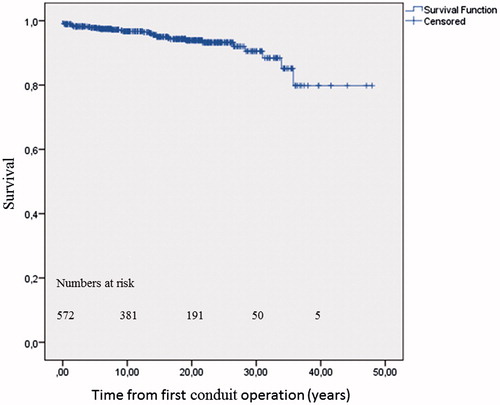
Figure 3. Kaplan-Meier estimates of reintervention-free survival from first conduit operation according to diagnosis. A: tetralogy of Fallot; B: mixed congenital heart disease; and C: Ross operation for aortic valve disease. Log-rank P < 0.001.
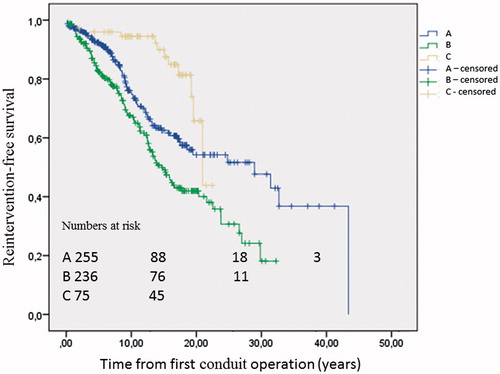
Table 2. Cox regression analysis of factors associated with reintervention-free survival after first conduit operation and after first conduit reintervention.
Figure 4. Kaplan-Meier estimates of reintervention-free survival after first conduit operation, n = 566 (A) and first conduit reintervention, n = 176 (B). Log-rank P = .04.
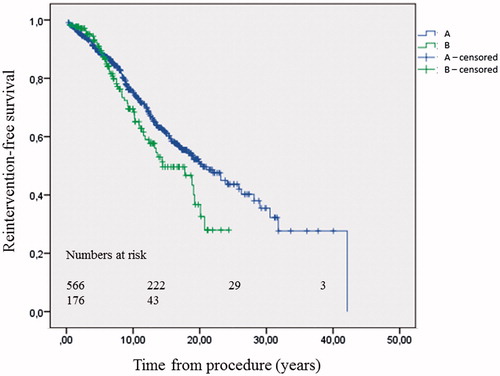
Table 3. Characteristics of patients with conduit reintervention.