
Figures & data
Table 1. Baseline characteristics of the RMN and manual groups.
Figure 1. CARTO maps (left) and CT images (right) of the LA in a patient with paroxysmal AF who underwent 1st ablation in the RMN group, PA (upper) and LAO (lower) views, showing detailed reconstruction of the PV antrum as well as PV encircling ablation lines. Note linear ablation was even applied between the well-separated right-sided upper and lower PVs, but only encircling around the common left PV.
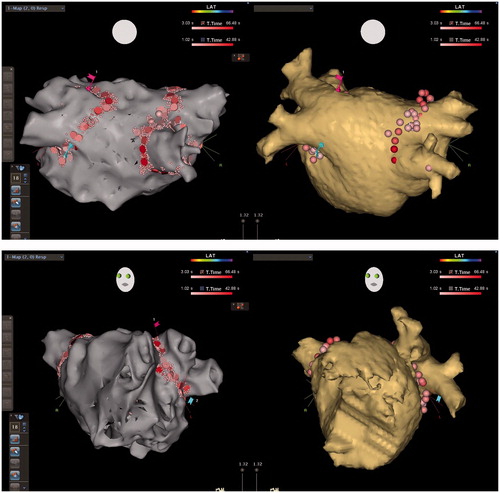
Figure 2. CARTO voltage maps (left) and CT images (right) of the LA in a patient with persistent AF who underwent 2nd ablation in the RMN group, AP (upper) and LAO (lower) views respectively, showing again detailed reconstruction of the PV antrum as well as reconnections to the antero-inferior right upper and antero-inferior right lower PV where RF applications were added to re-isolate these PVs. RF ablations were also conducted against recordable local electrograms along the ridge between the atrial appendage and the left PVs in order to abolish potential substrate for re-entry, even reconnection was not identified to the left PVs.
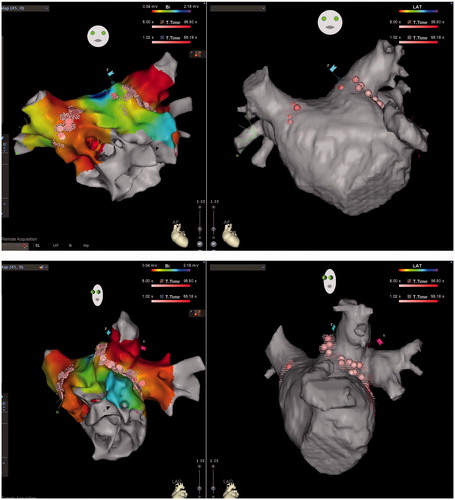
Table 2. Procedural parameters of the RMN and manual groups.
Figure 3. Kaplan-Meier survival analysis for AF/AT-Free (upper) and Clinically Effective (lower), showing the RMN technique is associated with statistically better outcomes both for AF/AT-Free (p< .05) and for Clinically Effective (AF/AT-Free + Clinically Improved, p < .005) survivals. Note by the end of each survival curve are the remaining case number (%).
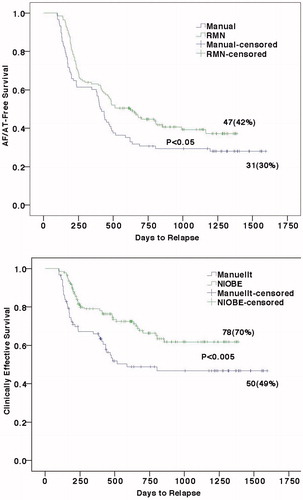
Table 3. Clinical outcomes of the RMN and manual groups.